You are currently viewing documentation for CompuTec AppEngine 2.0 (.NET Framework), which will be supported only until December 31, 2026. After this date, the product will no longer receive regular support or maintenance updates. Read more
We recommend upgrading to CompuTec AppEngine 3.0 built on .NET 8, which provides better performance and a modern, centralized installation process for CompuTec ProcessForce and other CompuTec solutions.
Please note that CompuTec AppEngine 3.0 has a different architecture, and all CompuTec components need to be updated together to ensure full compatibility.
Please review the CompuTec AppEngine 3.0 documentation before starting your installation or upgrade process.
Current Task Flow vs. Gantt Chart
Modern manufacturing requires precision, real-time insights, and flexibility in monitoring operations. The Gantt Chart and Current Task Flow views offer powerful visualizations to help track and manage your production schedule efficiently. This guide explores the available features, how to define custom views, and how to interpret real-time data using the Gantt interface.
Here, you can find information on scenario definition.
Add New View
The "Add New View" function allows users to define specific scenarios by filtering the elements displayed on the Gantt chart. This enables focused analysis of selected resources. You can organize your view by departments or machine types to better monitor specific areas of production.
Clickhere to know more.
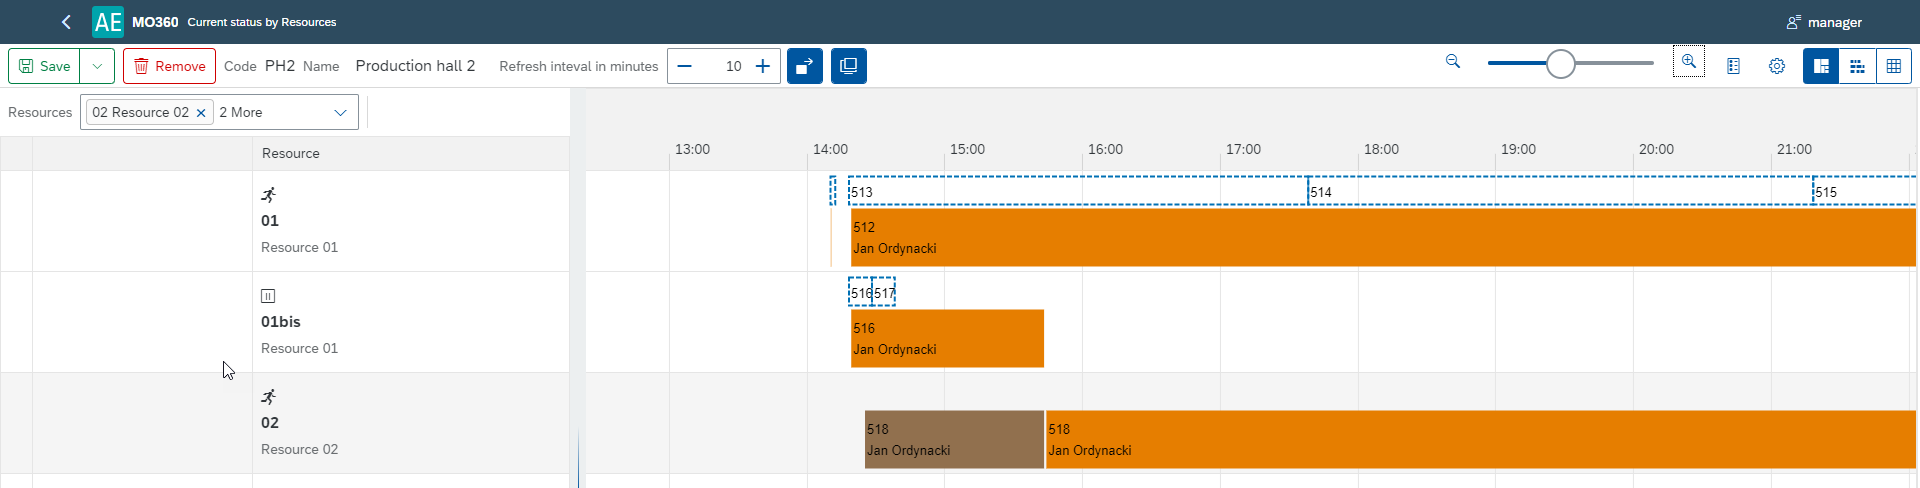
Change Scope Tabs
The Gantt chart offers flexible customization options to tailor the display according to user needs. Key features include:
-
Refresh interval in minutes: Possibility to change the frequency of refreshing the progress of manufacturing orders:

-
Display details – click on a Task to view its details. Possibility to check details broken down into:
-
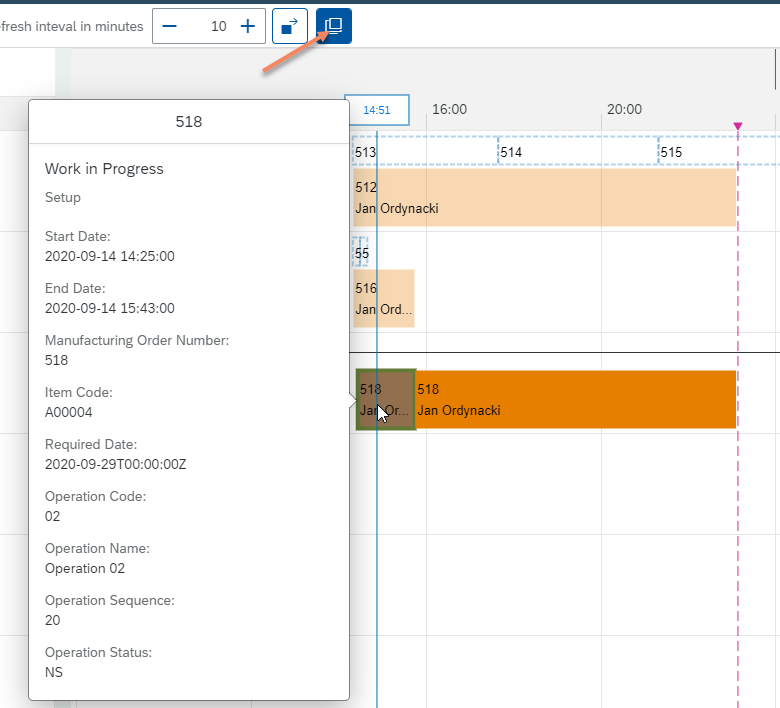
Show quick view: The ability to view the details of the operation of a given Manufacturing Order. The information is shown in the form of a window that appears when you hover over the Task:
-
Zoom: Increases or decreases the details of the display results:

-
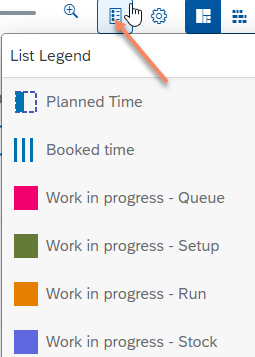
List Legend: Describes the displayed colours and characters:
-
Settings -

-
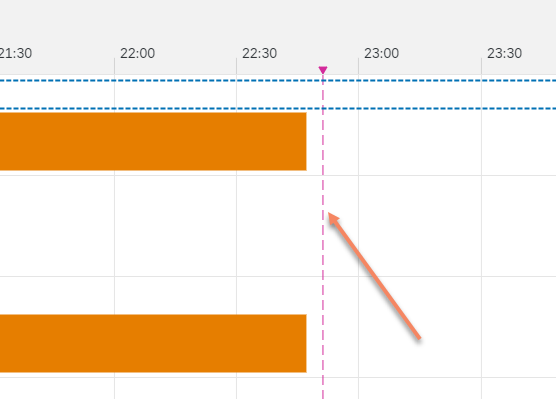
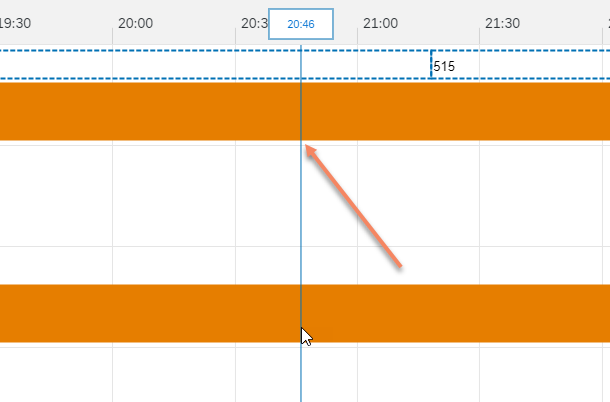
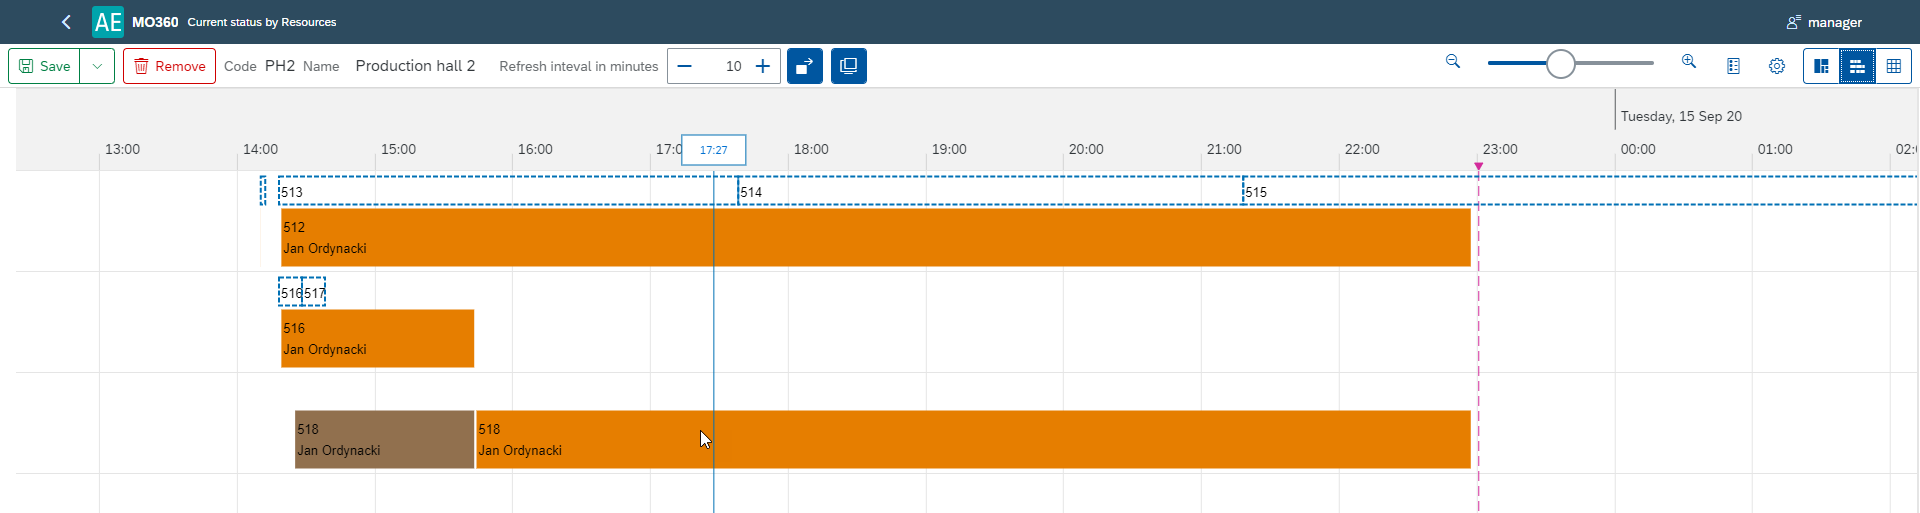
Indicate Current Time: Shows the current time on view:
-
Show Cursor Line: Shows the time of a place on the graph pointed by a cursor:
-
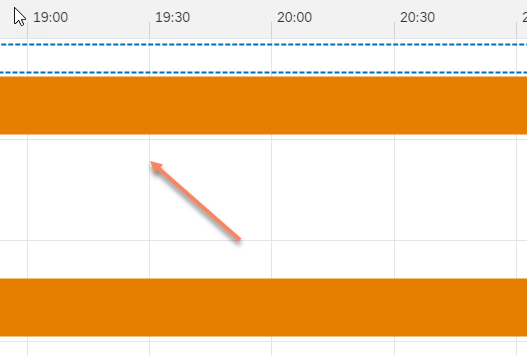
Show Divider Lines: Shows a time division grid:
-
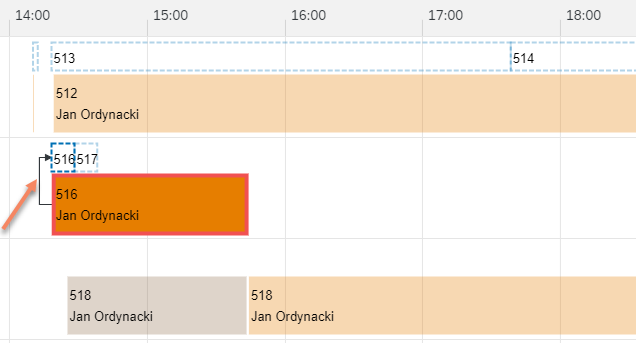
Show Ad Hoc Lines: Shows the relationship between a planned and an actual Task:
-
Synchronize Time Scroll: The graph returns to the current date after a specified interval in minutes.
-
-
Display

-
Table and chart:
-
Chart:
-
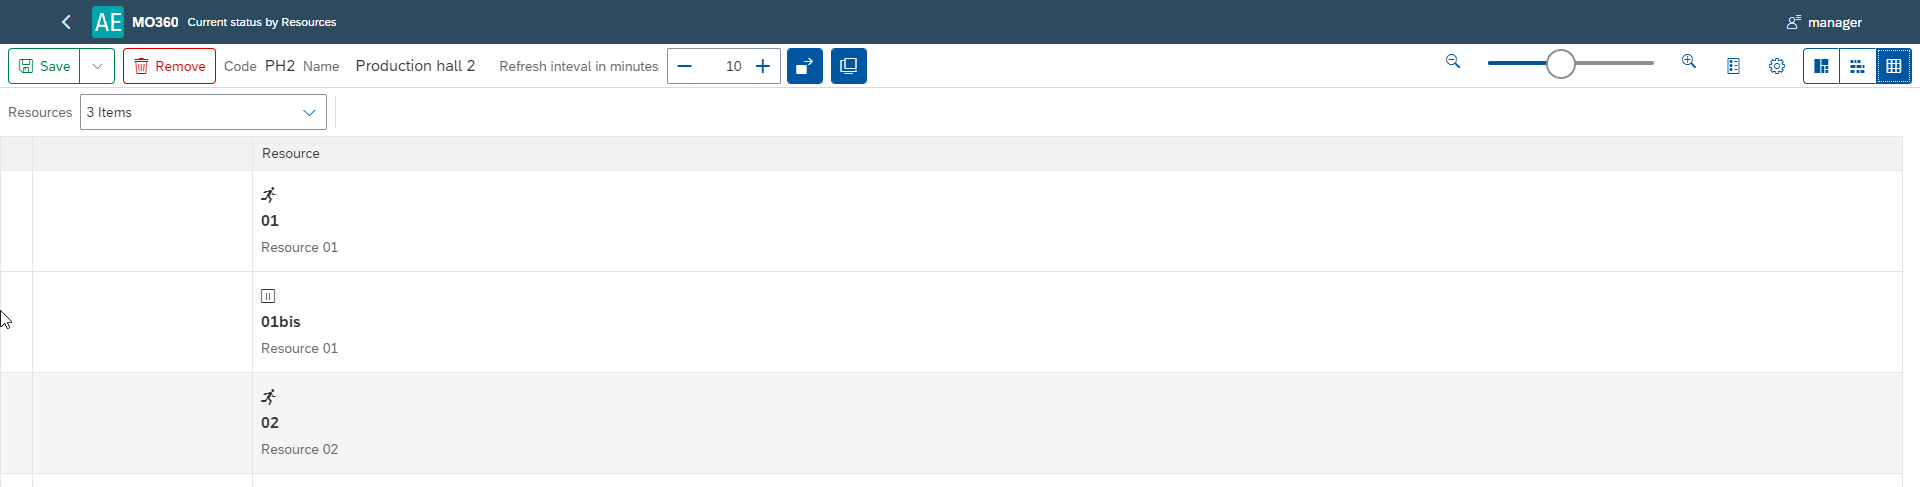
Table:
Click here to know more.
-
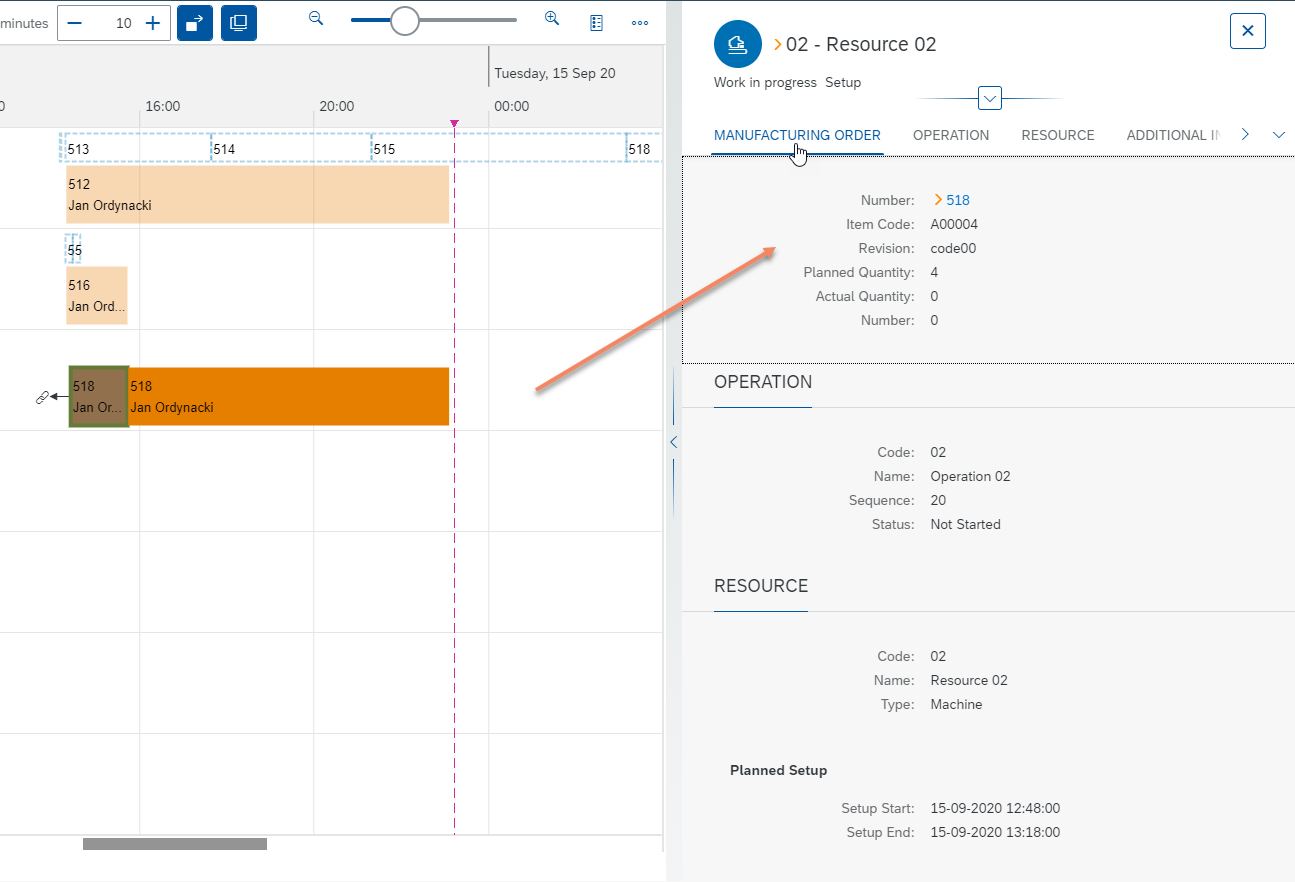
Display Details
Work-in-progress
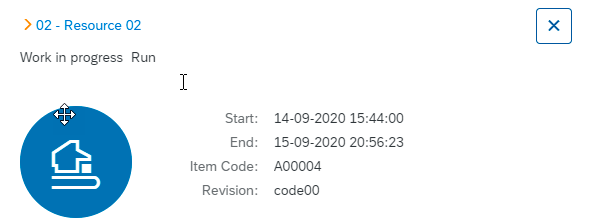
The side panel shows details of a Task flow on a Resource. The data is presented in real time, showing the current Set up Time or Run time.
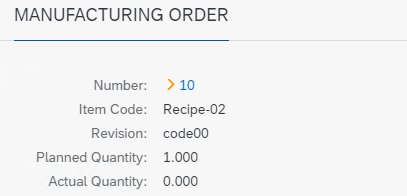
Manufacturing Order
-
Manufacturing Order details (Number, Item Code, Revision, Planned and Actual Quantity, Required Date)
Operation
-
Operation details (Code, Name, Sequence, Status)

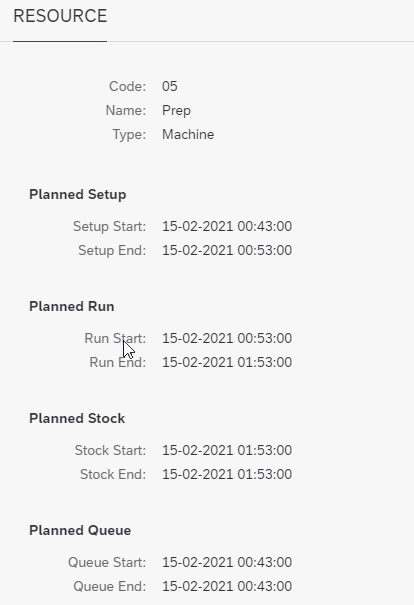
Resource
-
Resource details (Code, Name, Type)
-
Time details (start and end time of all time types)
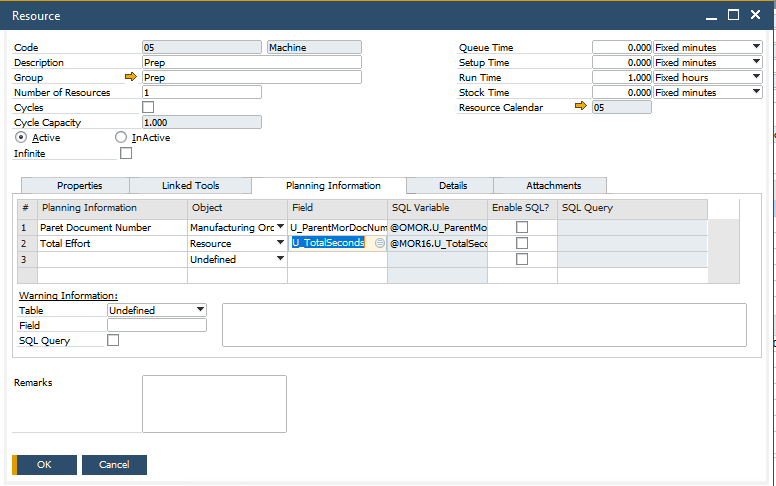
Additional information
-
Additional information from a Resource

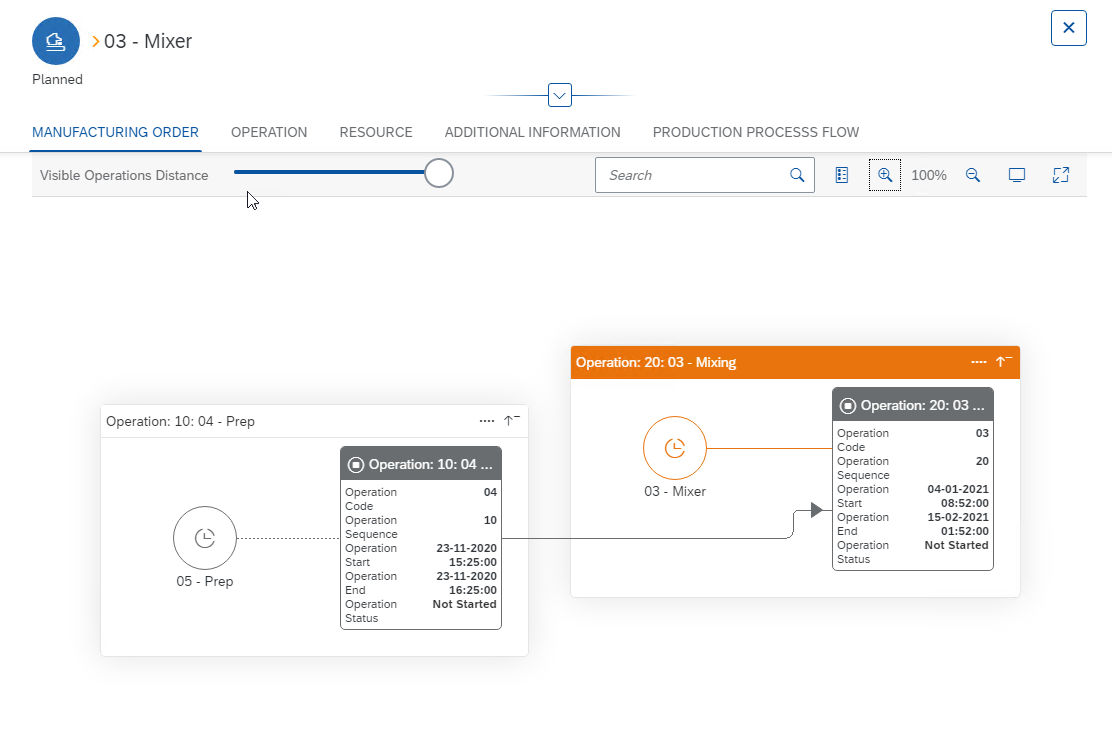
Production Process Flow
-
Graphical representation of the manufacturing process for a Manufacturing Order