Setting Up Telemetry with Grafana.com
Telemetry is vital for monitoring and analyzing the performance of your systems, ensuring they operate optimally. By leveraging Grafana's robust tools, you can streamline monitoring and gain valuable insights into your AppEngine and SAP Business One environments. This guide walks you through setting up telemetry with Grafana, configuring profiles, and viewing logs and metrics.
Steps to Setup Telemetry using grafana.com
-
Visit grafana.com and create an account.
-
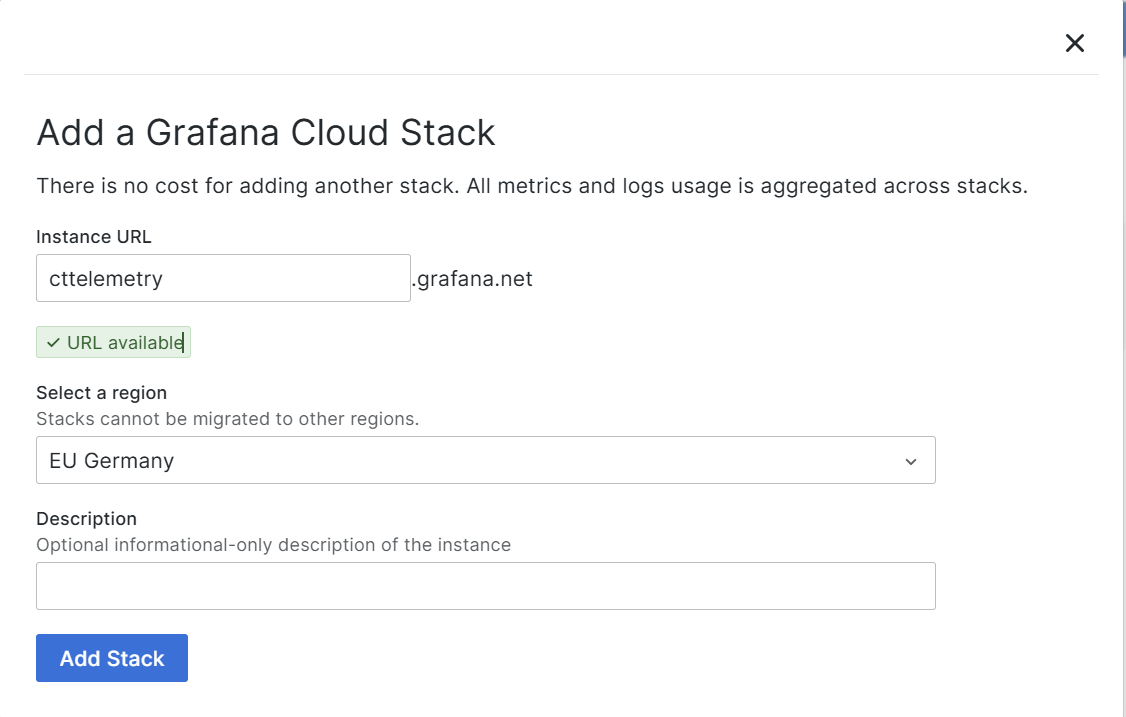
After logging in, create a Stack within Grafana.

-
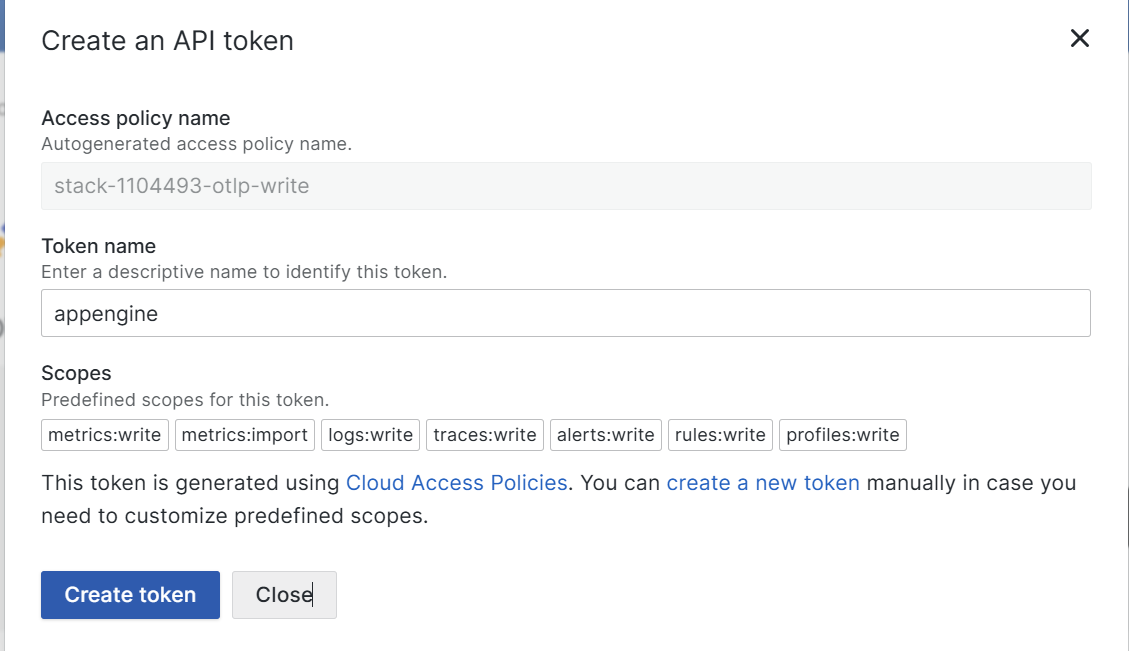
Generate an API Token under the credentials section of your stack.

-
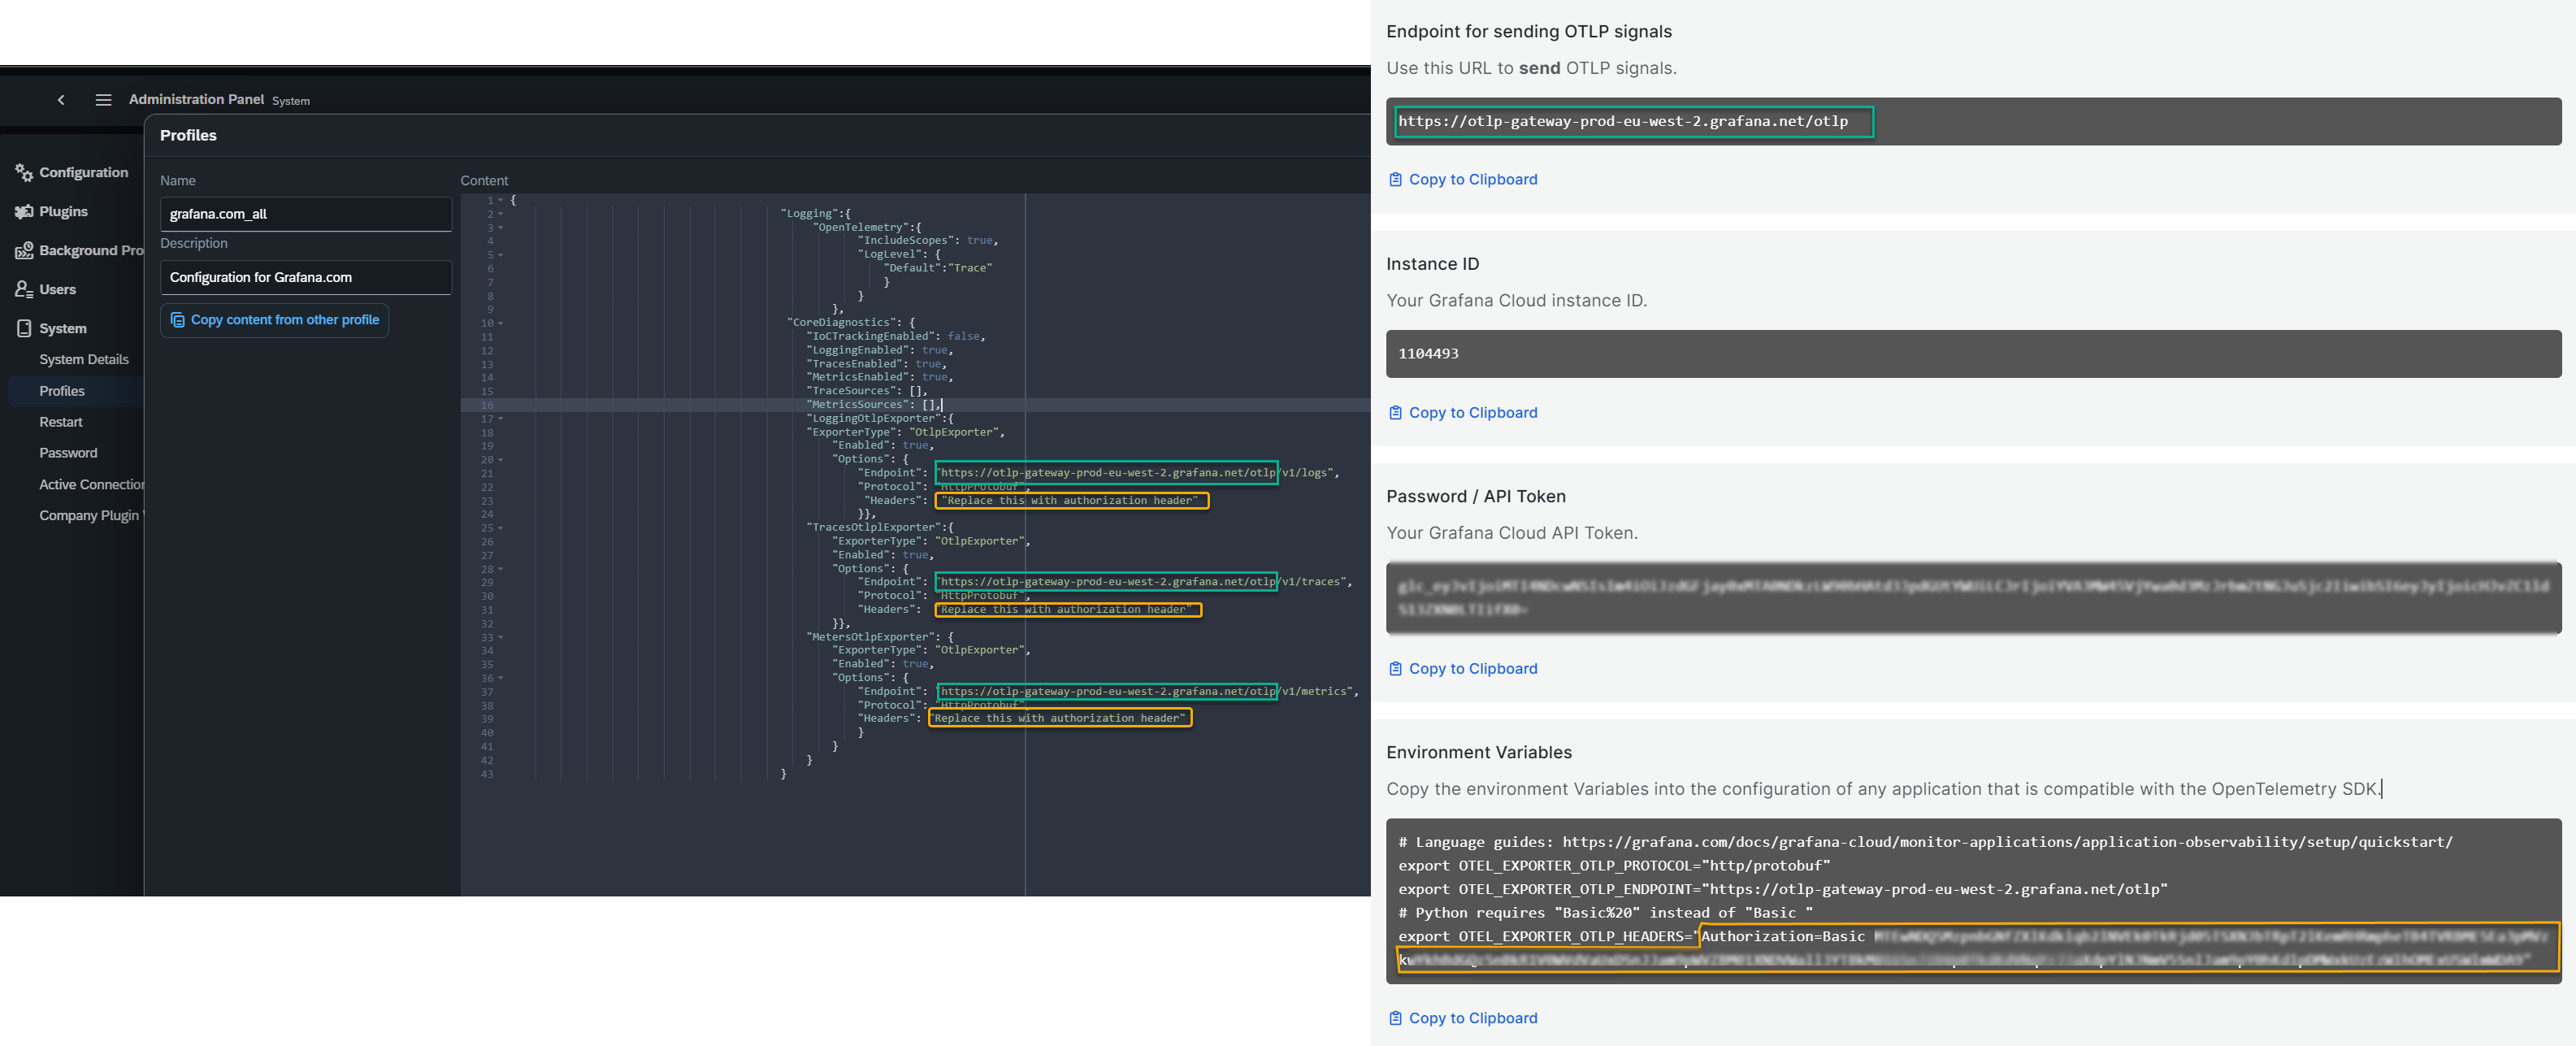
Create profile in AppEngine by cloning the predefined
OpenTelemetry_All
-
Fill the Endpoint and Authorization Header by copying the details from your Grafana account.

-
Save the profile. This profile now can be specified in the AppEngine Configuration.
Assigining the Profiles to AppEngine
To assign a profile to the AppEngine instance:
-
Navigate to AppEngine Administration > Configuration > AppEngine Servers.
-
Assign the profile to the relevant AppEngine instance.

-
Restart the AppEngine Service to apply the changes.
Assigining the Profiles to Sap Business One
To assign the profile to the Company:
-
Go to AppEngine Administration and select the active company.
-
Assign profiles:
- To all users in the company
- Or to specific users needing tailored configurations
-
To assign the default profile, just specify the profile in the company details.

-
To assign the profile for specific company, please select User profiles section and fill the necessary information:

The changes will take effect after restarting Sap Business One.
Viewing the Profiles and Logs
-
Clock lounch in your stack
-
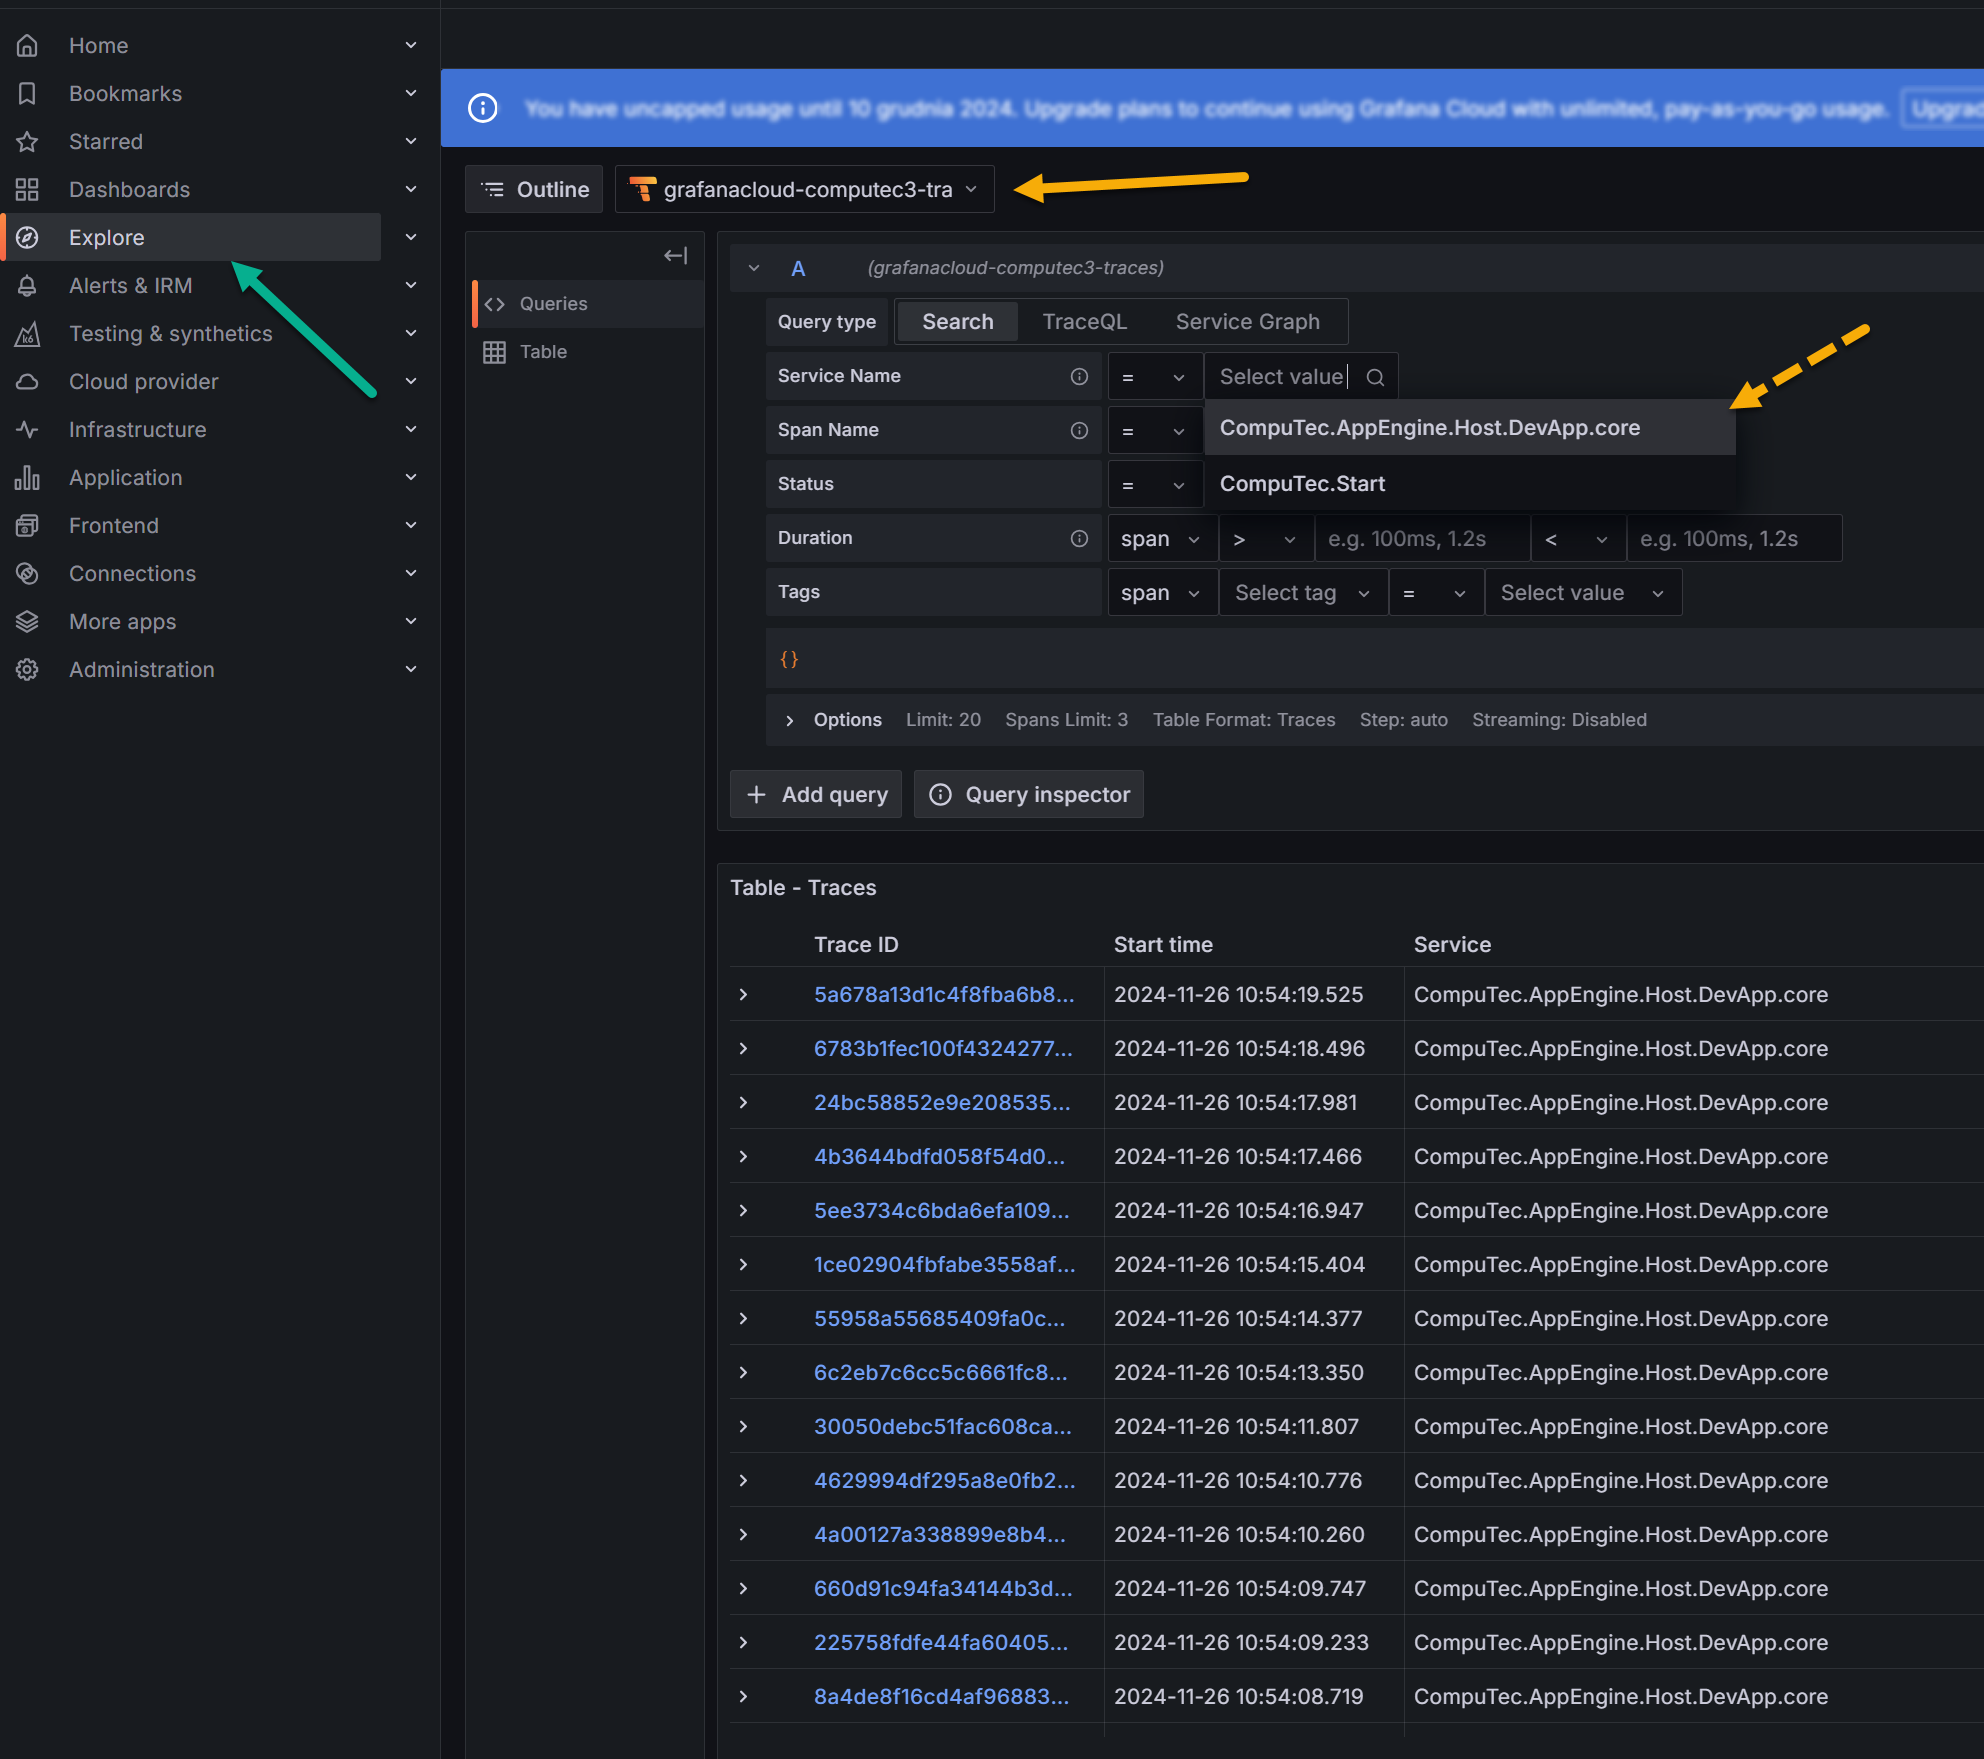
Explore the telemetry by clicking the explore chose the exploraton in the combobox ( yellow arrow)

Choose an exploration method from:
- Traces - View time-based traces
- Logs- Inspect logs
- Prometheus - Analyze metrics
Service Name - Under the Resource section, locate and input the User Name and Database Id to ensure accurate telemetry tracking.
- Computec.AppEngine.Host – AppEngine Service.
- Computec.Start – SAP Business One Plugin Activity.
Setting up telemetry with Grafana provides invaluable visibility into your AppEngine and SAP Business One operations. By monitoring traces, logs, and metrics, you can quickly identify and resolve issues, ensuring a seamless experience for users. This proactive approach to system monitoring enhances efficiency and boosts operational performance.