You are currently viewing documentation for CompuTec AppEngine 3.0 (.NET 8).
If you are working with older environments, you may need the documentation for CompuTec AppEngine 2.0 based on .NET Framework: https://learn.computec.one/docs/appengine/2.0/.
Please note that CompuTec AppEngine 2.0 will be supported only until December 31, 2026. After this date, the product will no longer receive regular support or maintenance updates. Read more
As CompuTec AppEngine 3.0 introduces a new architecture, all CompuTec components must be updated together to ensure full compatibility.
Please review the CompuTec AppEngine 3.0 documentation before starting your installation or upgrade process.
OpenTelemetry Configuration
OpenTelemetry lets you monitor system behavior and troubleshoot issues in CompuTec AppEngine and SAP Business One.
This guide explains how to connect your environment to a telemetry backend (such as Grafana Cloud) using an OpenTelemetry profile, and how to view logs, traces, and metrics.
Configure OpenTelemetry Profile
To configure OpenTelemetry in OpenTelemetry-compatible backend, for example, Grafana Cloud, follow these steps:
-
Visit Grafana website and create an account.
-
After logging in, create a new Stack.
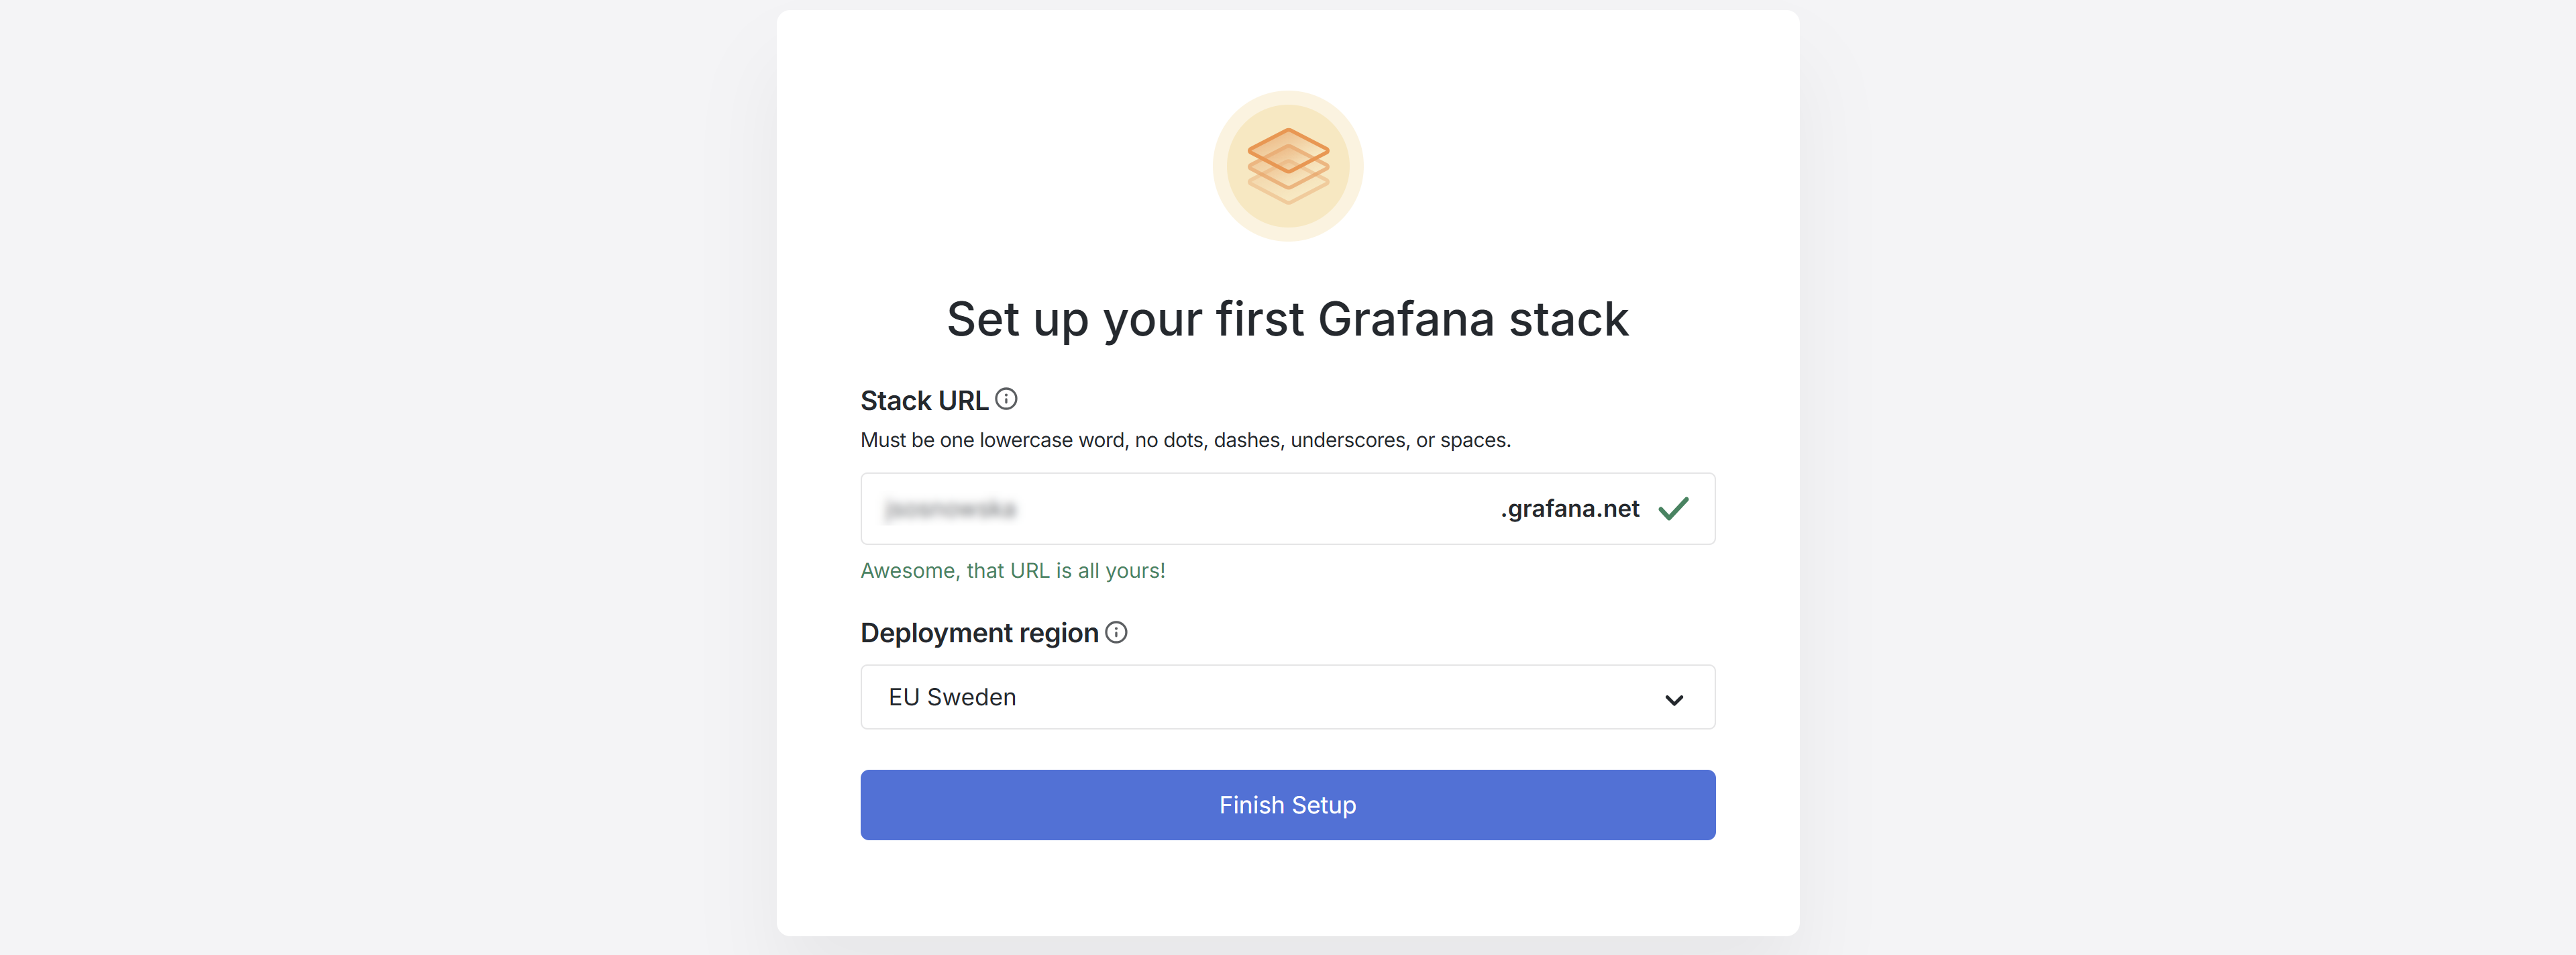
-
Go to My account.

-
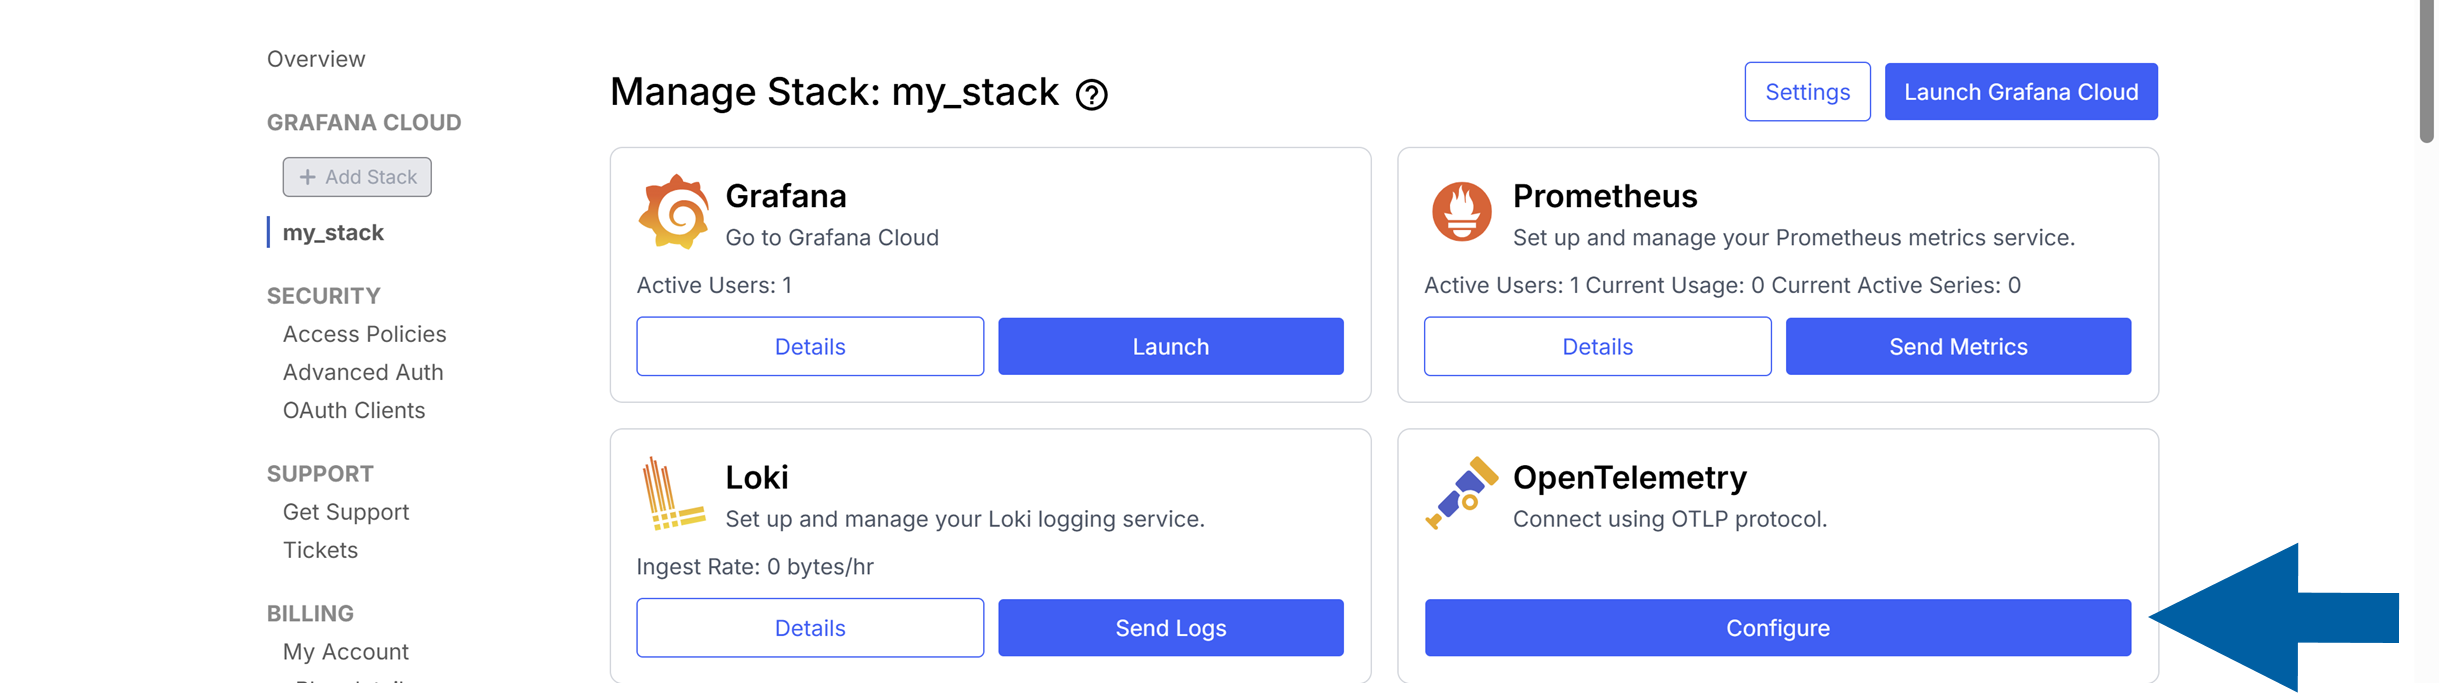
Click your stack name to manage it.

-
Find OpenTelemetry integration and click Configure.
-
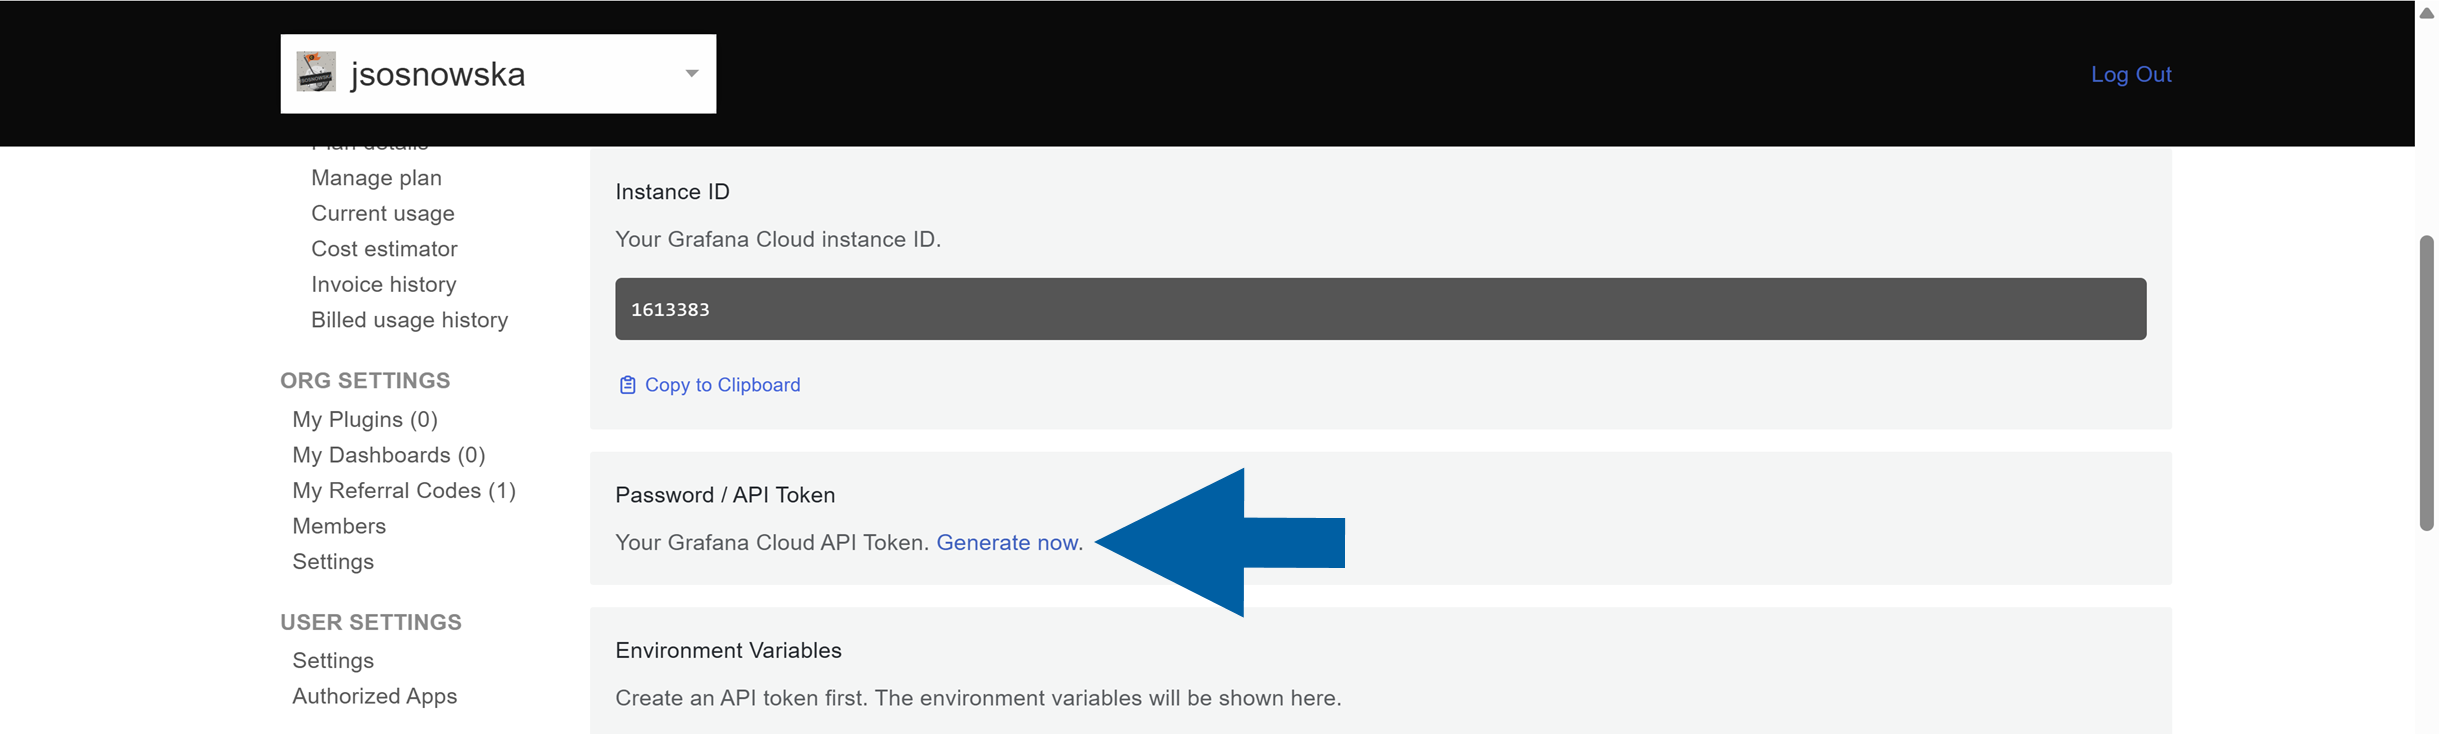
In Password / API Token, click Generate now.
-
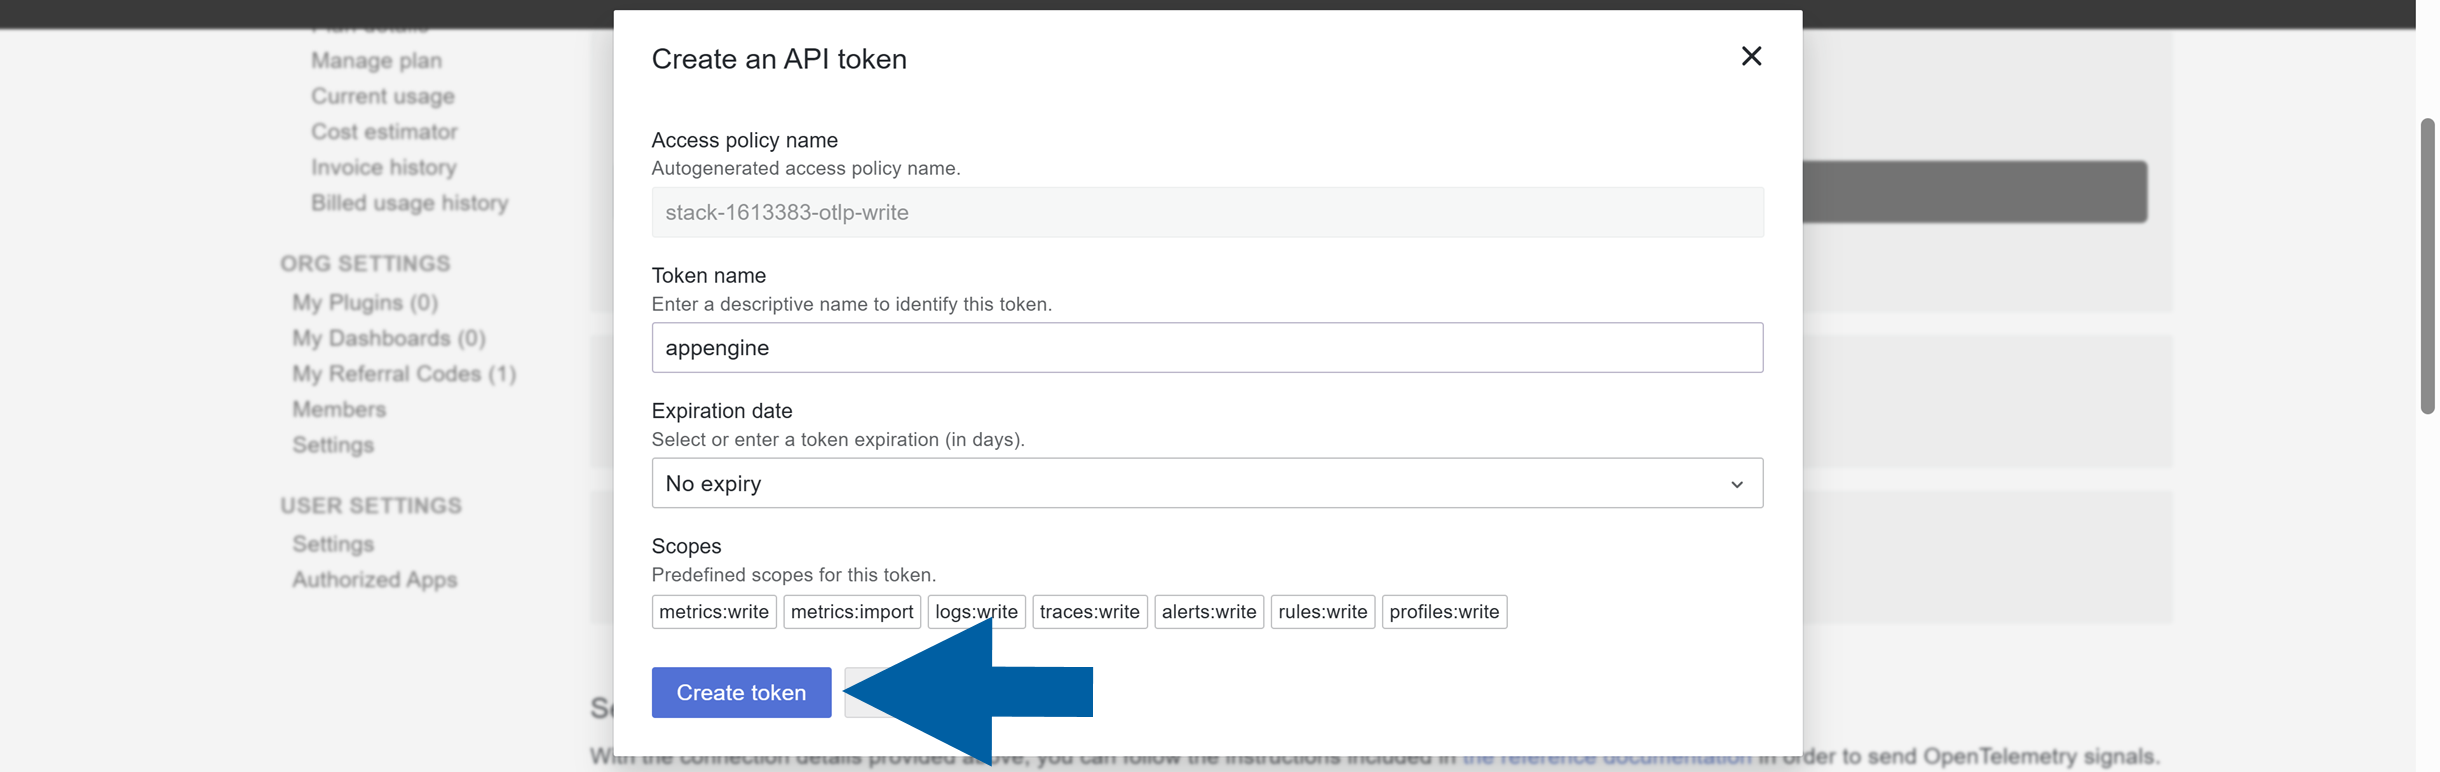
Name the token, set an expiry (or no expiry), and click Create token.
-
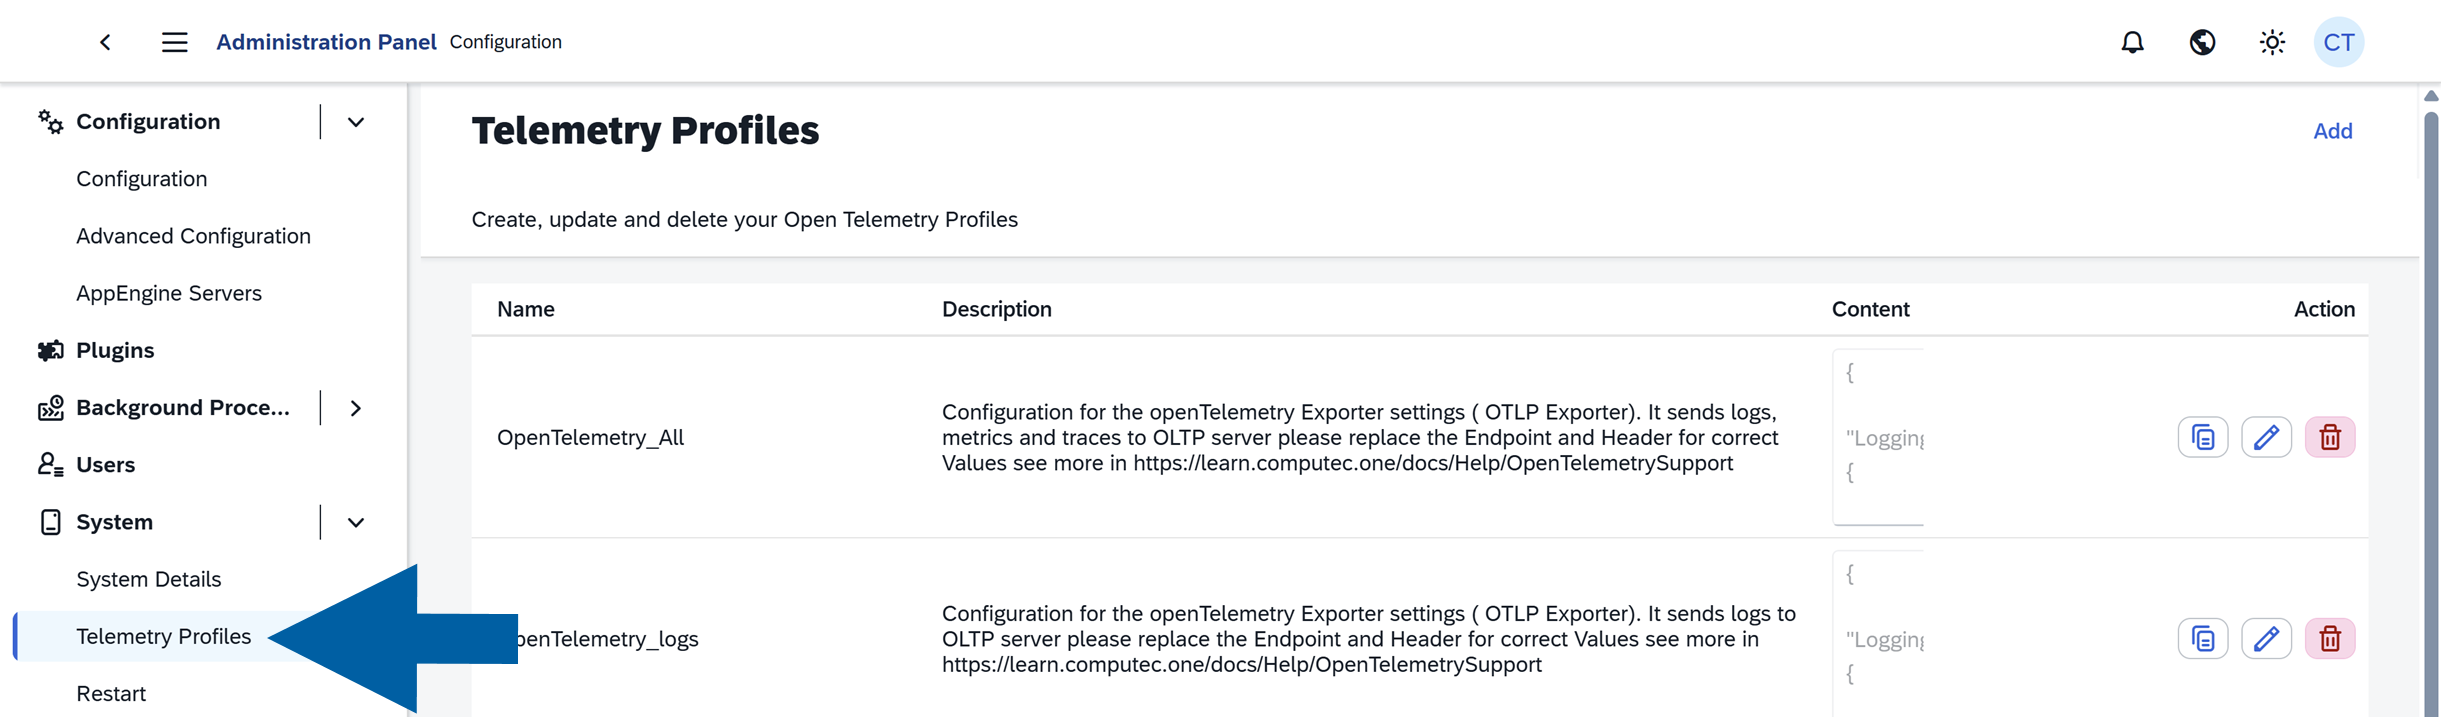
In CompuTec AppEngine Administration Panel, navigate to System > Telemetry Profiles.
-
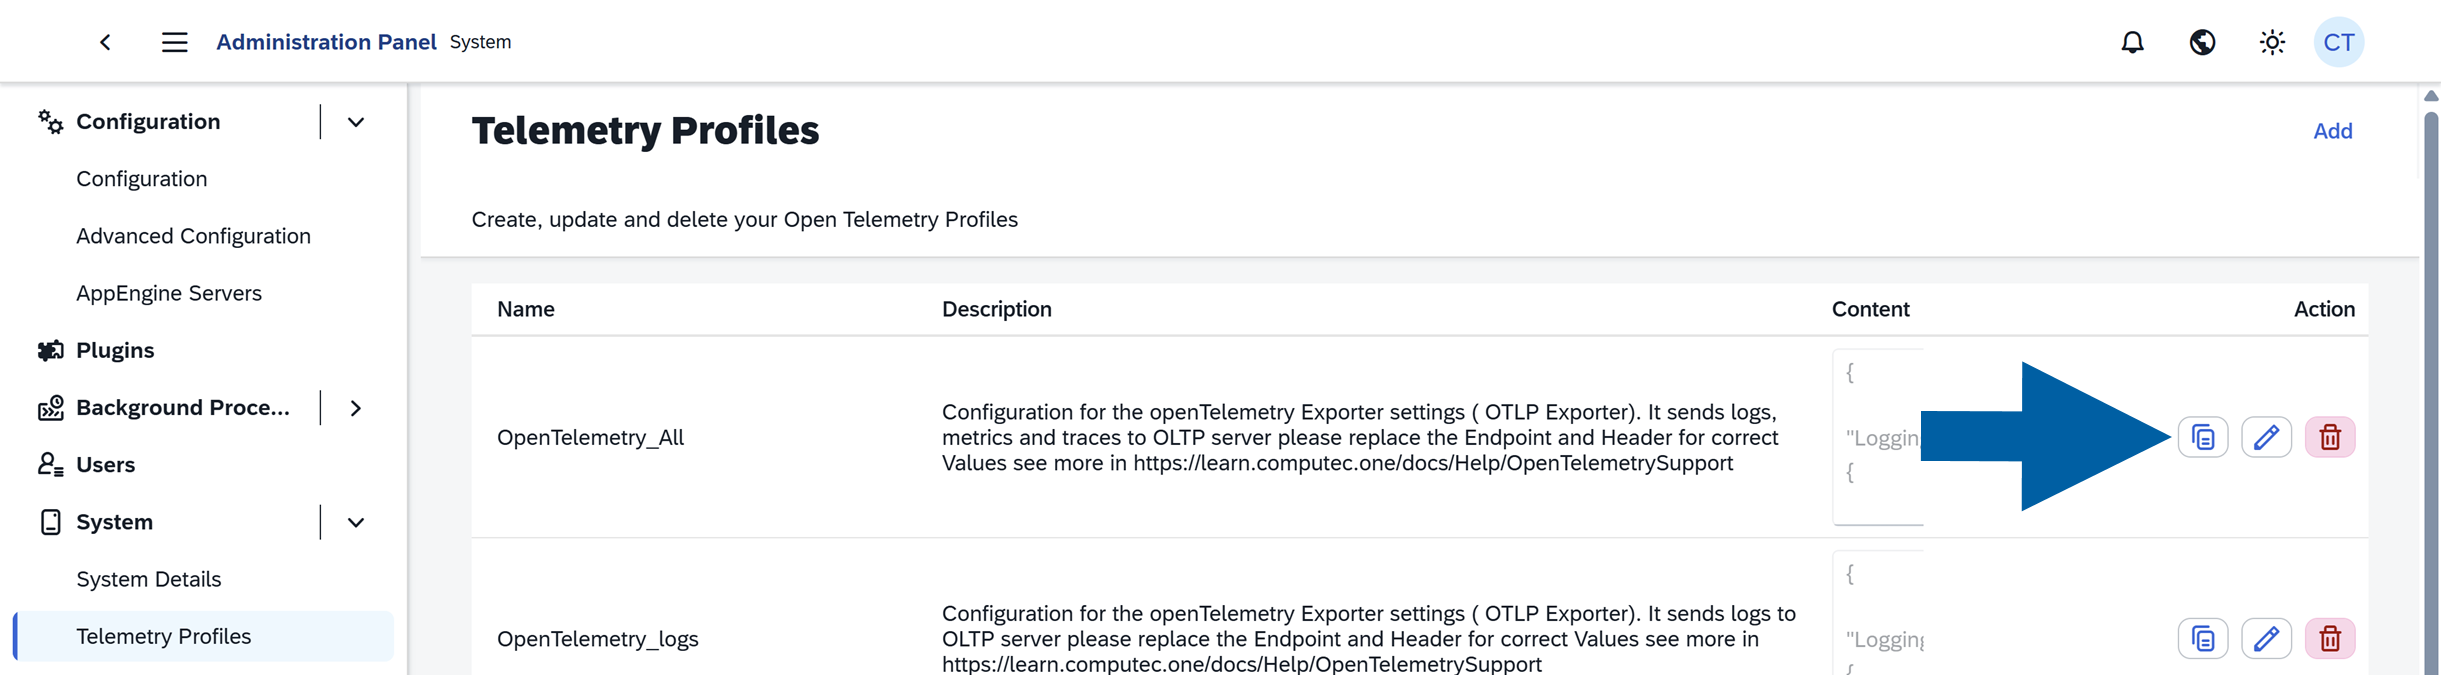
Create a new profile by clicking the copy icon next to the predefined OpenTelemetry_All profile.
-
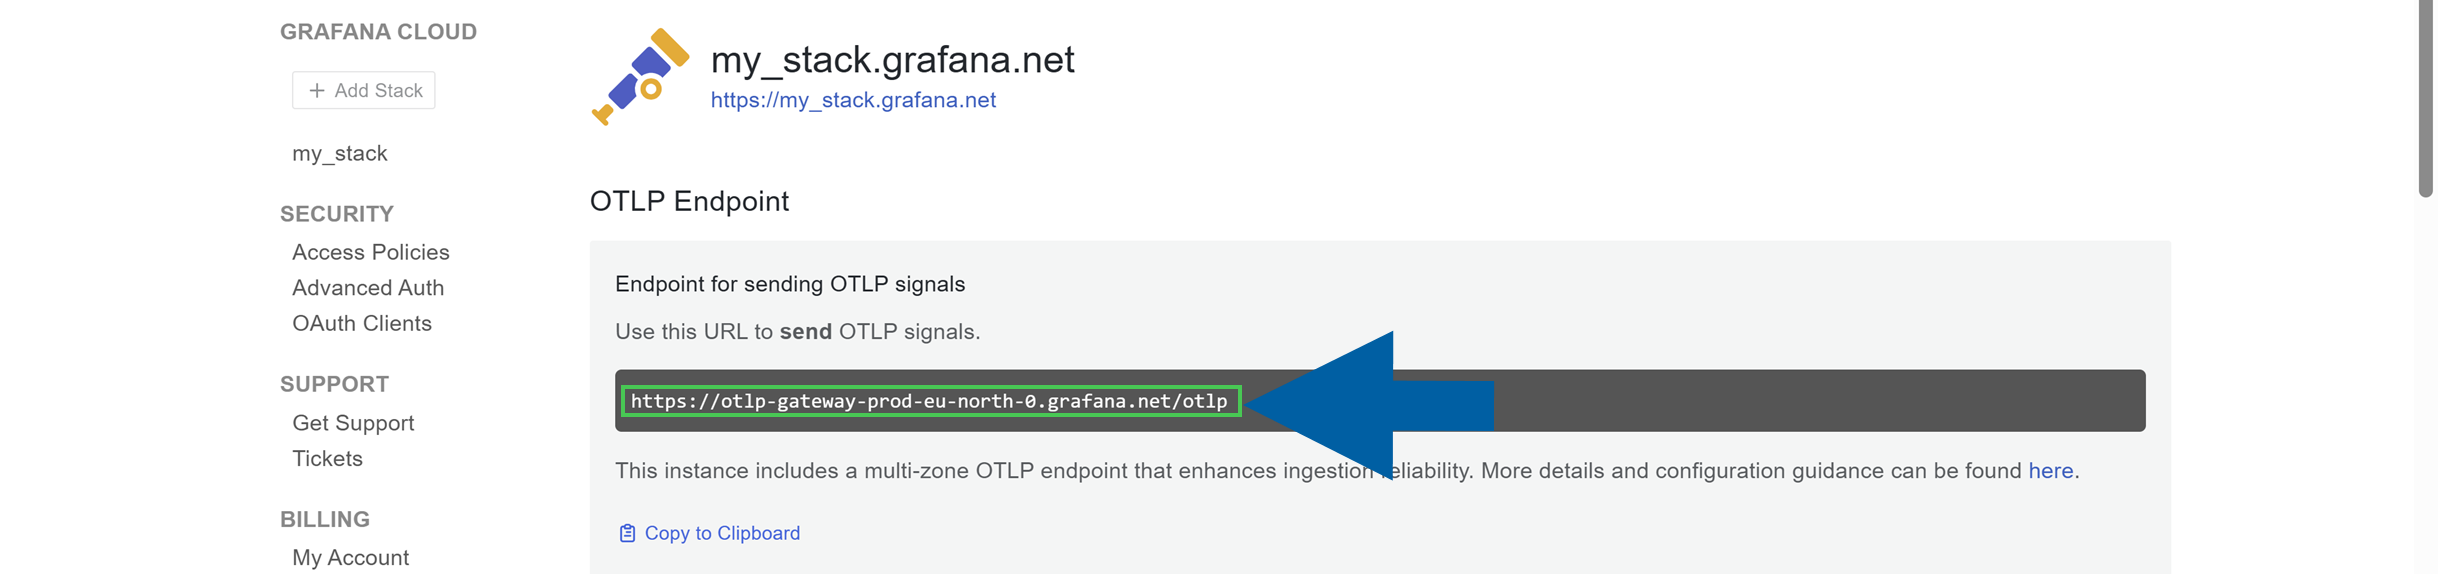
Copy Endpoint for sending OLTP signals from Grafana.com.
-
Paste it to all
Endpointfields in your new CompuTec AppEngine Open Telemetry profile.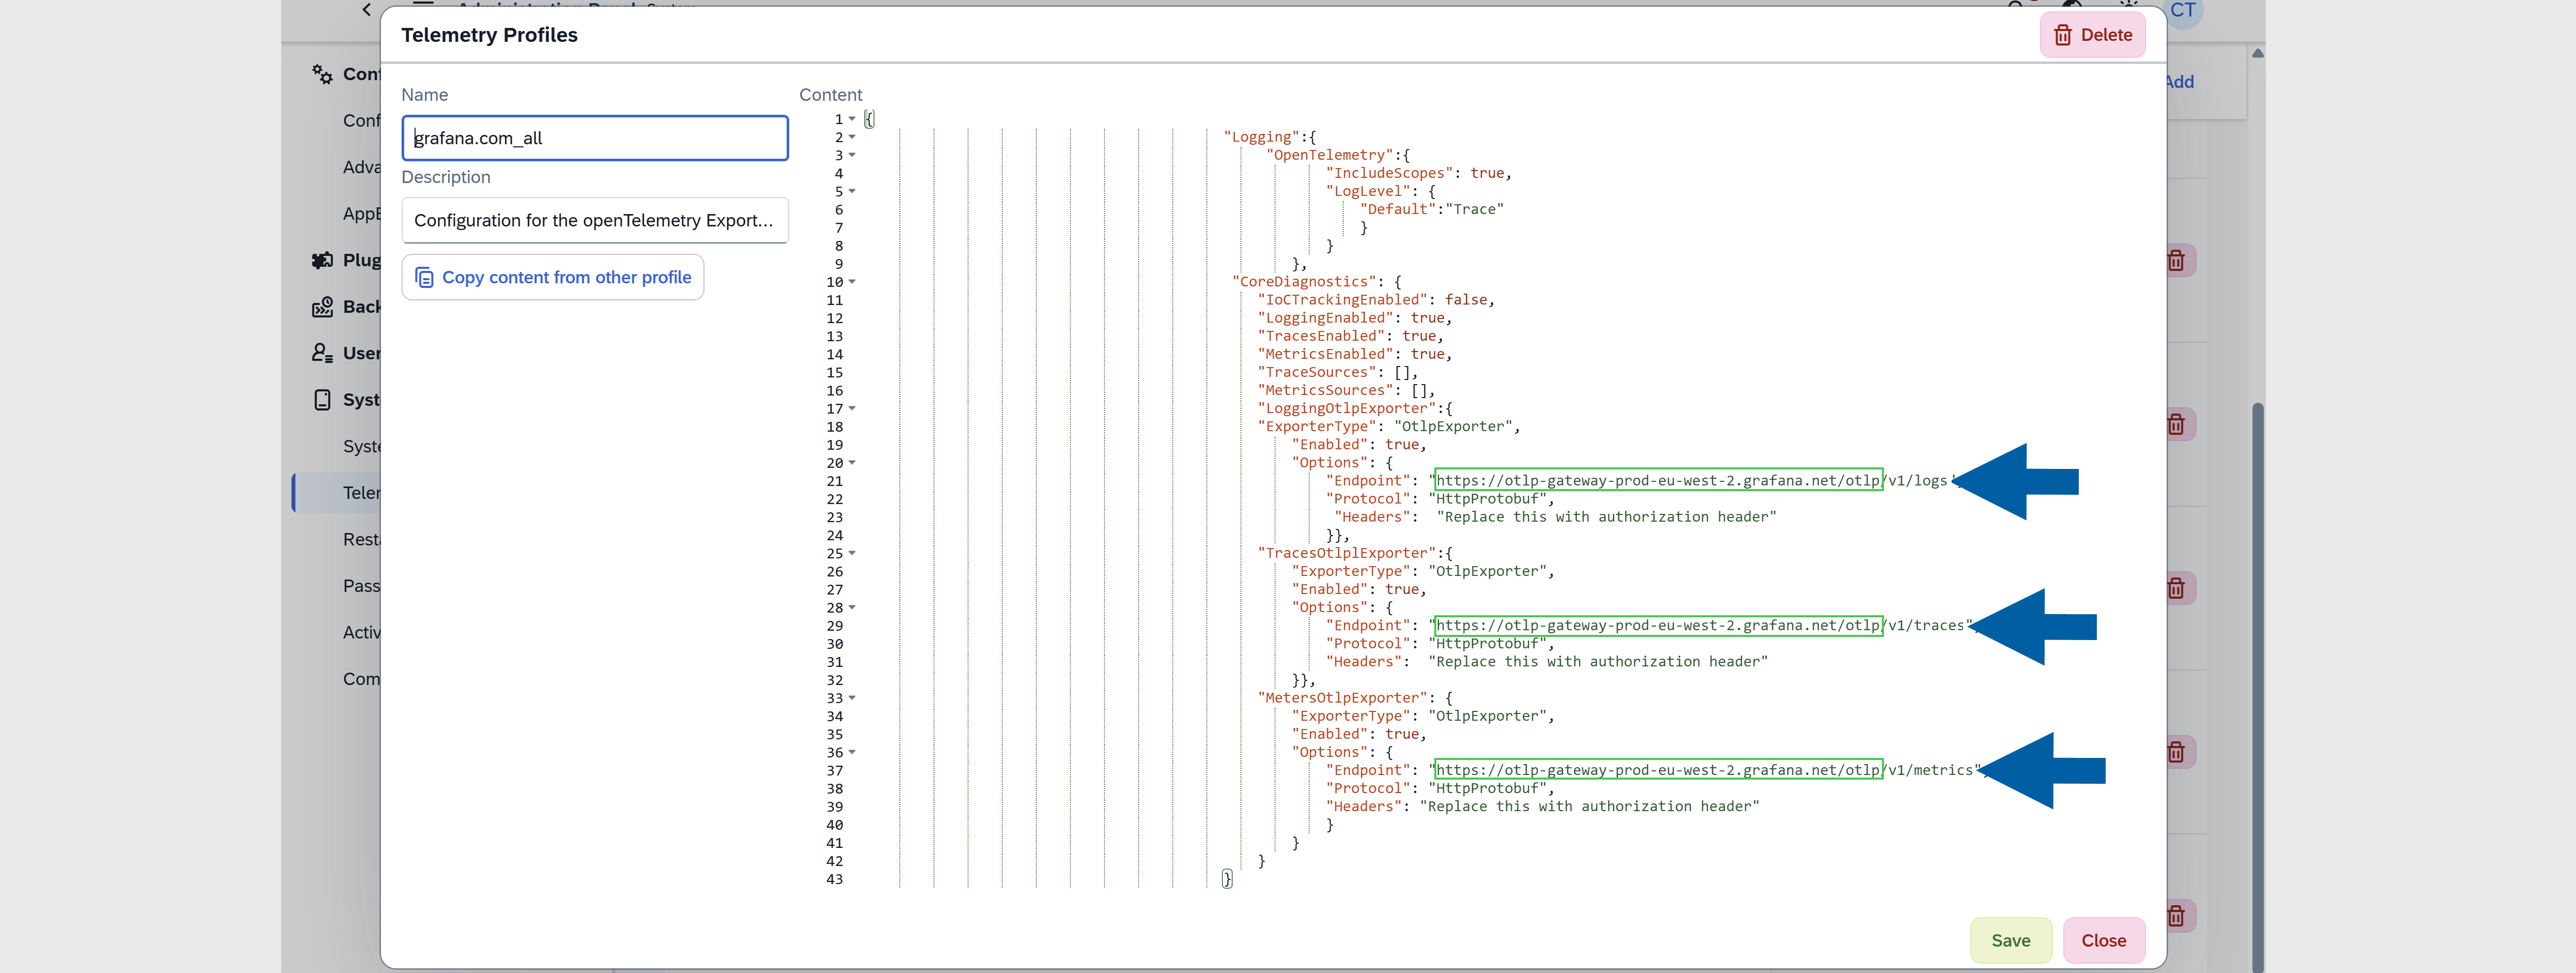 important
When replacing the OpenTelemetry endpoint, replace only the URL up to and including
/otlp. Keep the endpoint suffix for each telemetry type:/v1/logsfor logs/v1/tracesfor traces/v1/metricsfor metrics
For example, if your OpenTelemetry endpoint is
https://example.com/otlp, usehttps://example.com/otlp/v1/logs,https://example.com/otlp/v1/traces, andhttps://example.com/otlp/v1/metricsin the corresponding configuration entries. -
Copy Environmental Variable OTLP Header from Grafana.com.
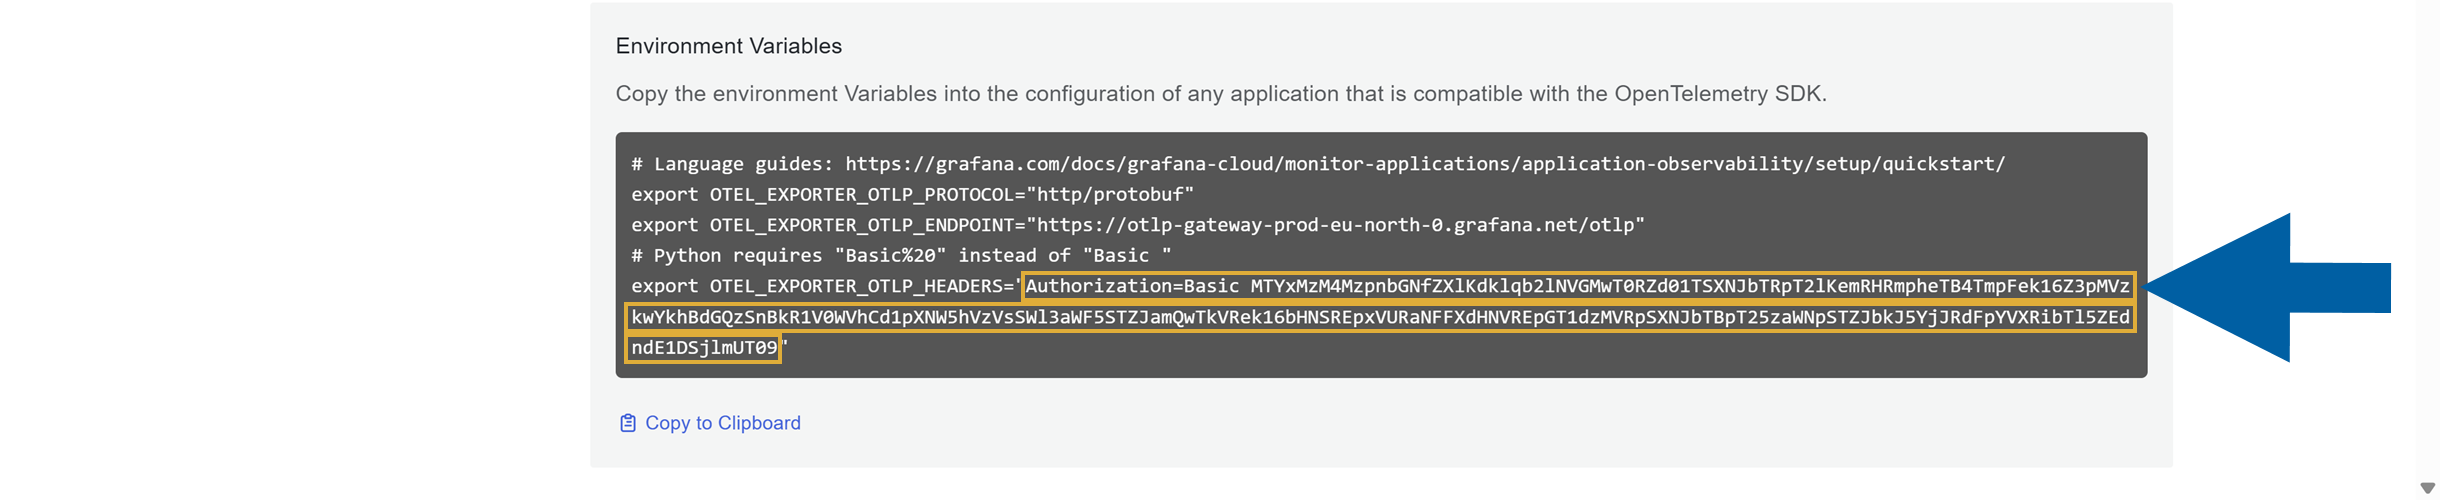
-
Paste it to all
Headersin your new CompuTec AppEngine Open Telemetry profile.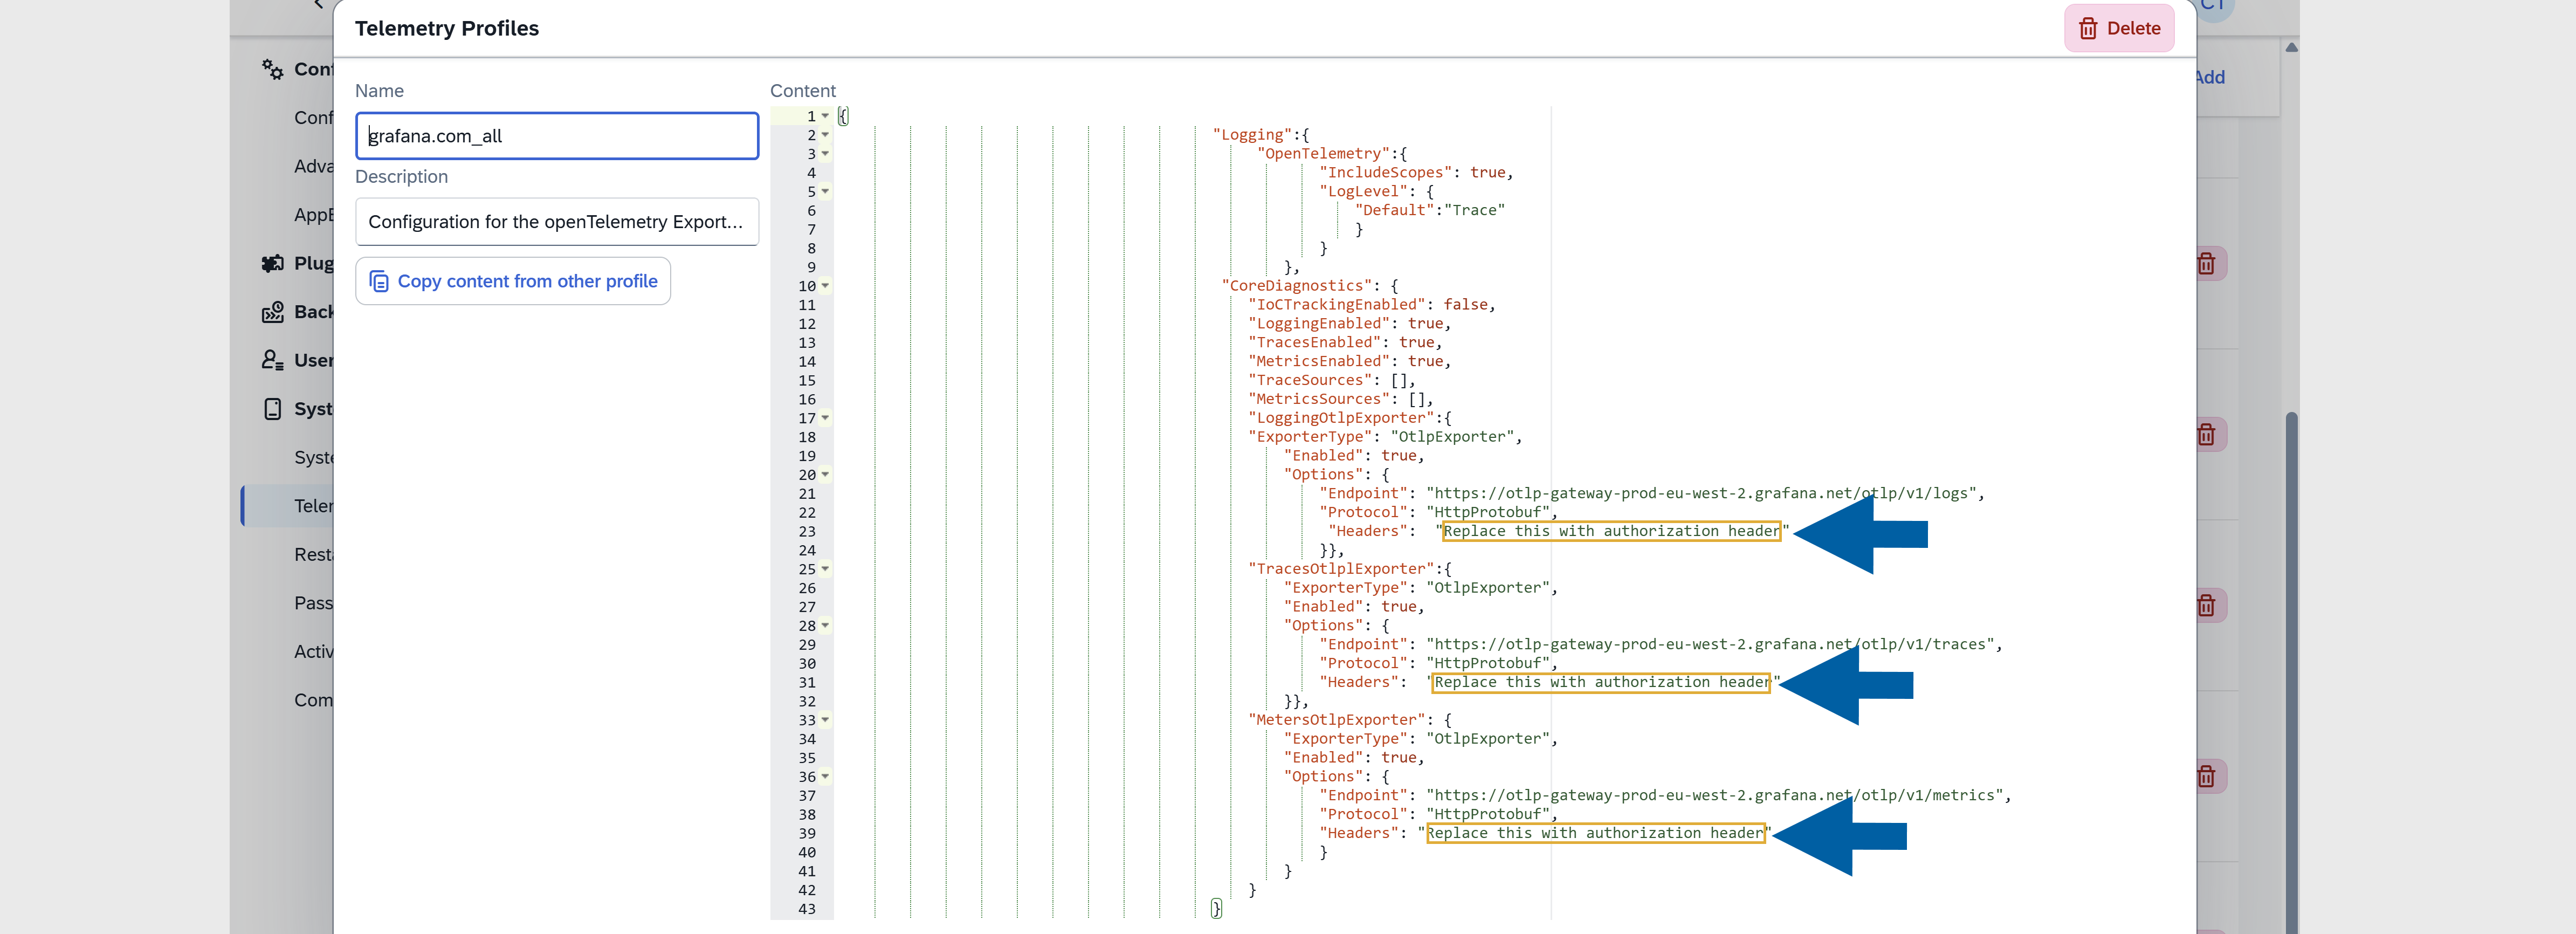
-
In CompuTec AppEngine Administration Panel, click Save.

-
Done! Now you can see this profile on the list in CompuTec AppEngine Administration Panel > System > Telemetry Profiles.
Assign OpenTelemetry Profile to CompuTec AppEngine
To assign a profile to the CompuTec AppEngine instance, follow these steps:
-
Navigate to CompuTec AppEngine Administration Panel > Configuration > AppEngine Servers.

-
Clcik the edit icon next to the chosen CompuTec AppEngine instance.

-
Click the OpenTelemetry profile you want to assign.

-
Now you can see the OpenTelemetry profile name in the list.
-
Restart the CompuTec AppEngine Service to apply the changes.
Assign the OpenTelemetry Profile to SAP Business One
To assign the OpenTelemetry profile to the Computec AppEngine company, follow these steps:
-
Go to CompuTec AppEngine Administration Panel > Configuration.
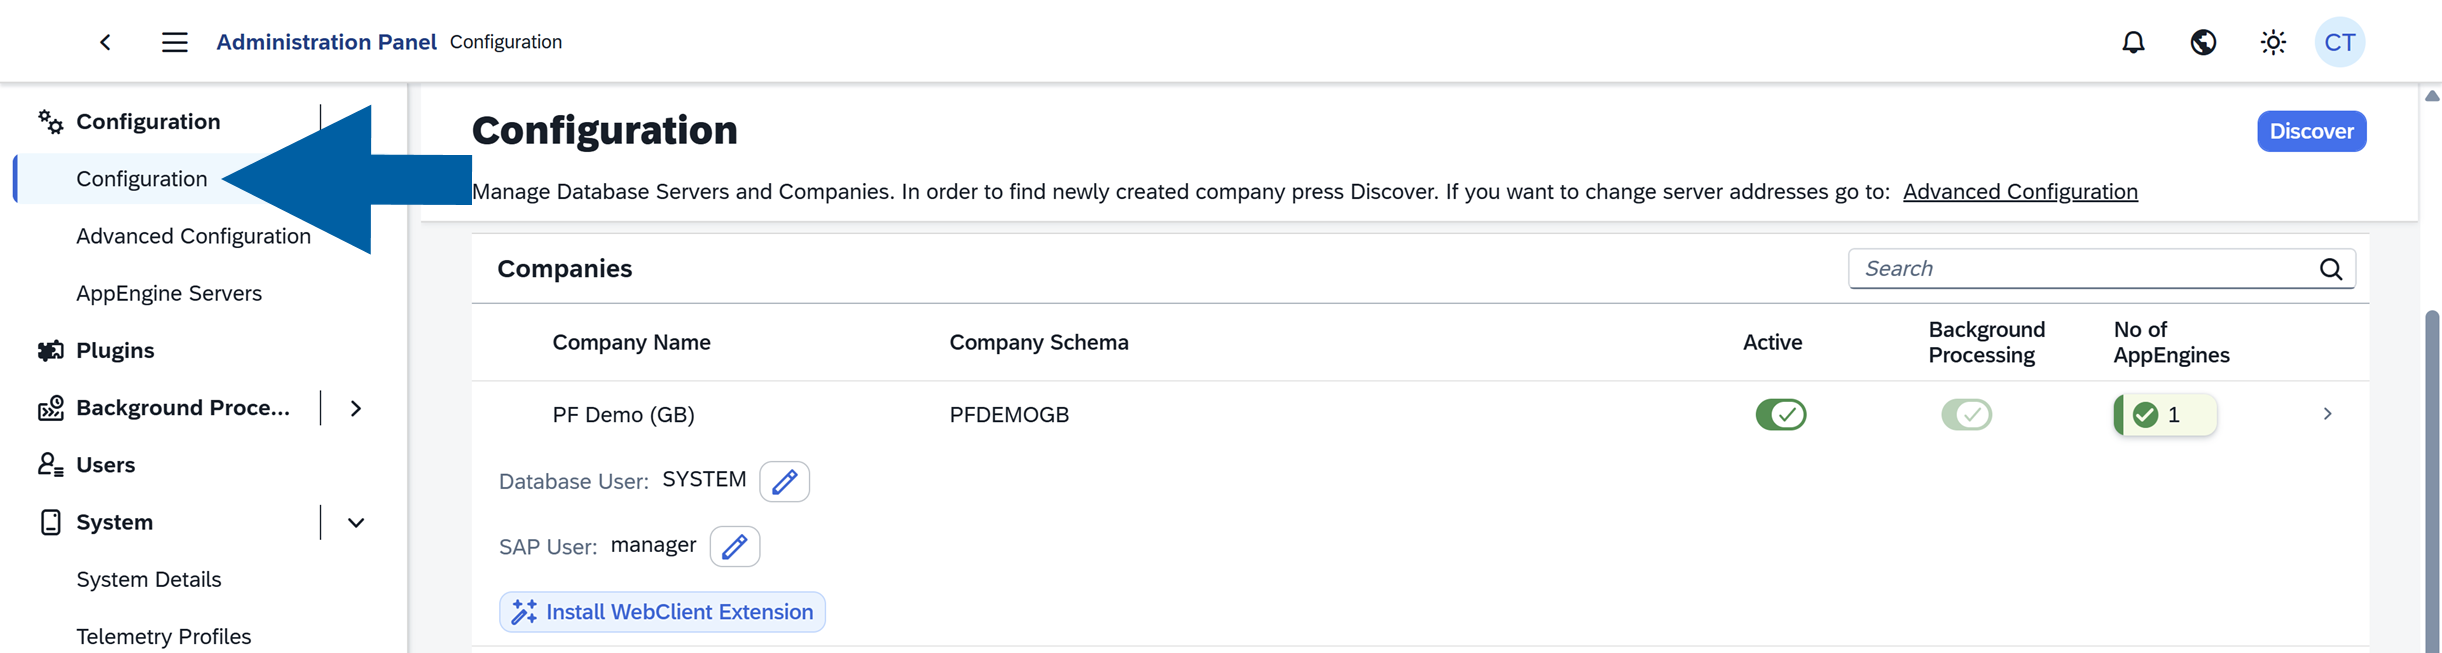
-
Choose the company name from the list to see its details.
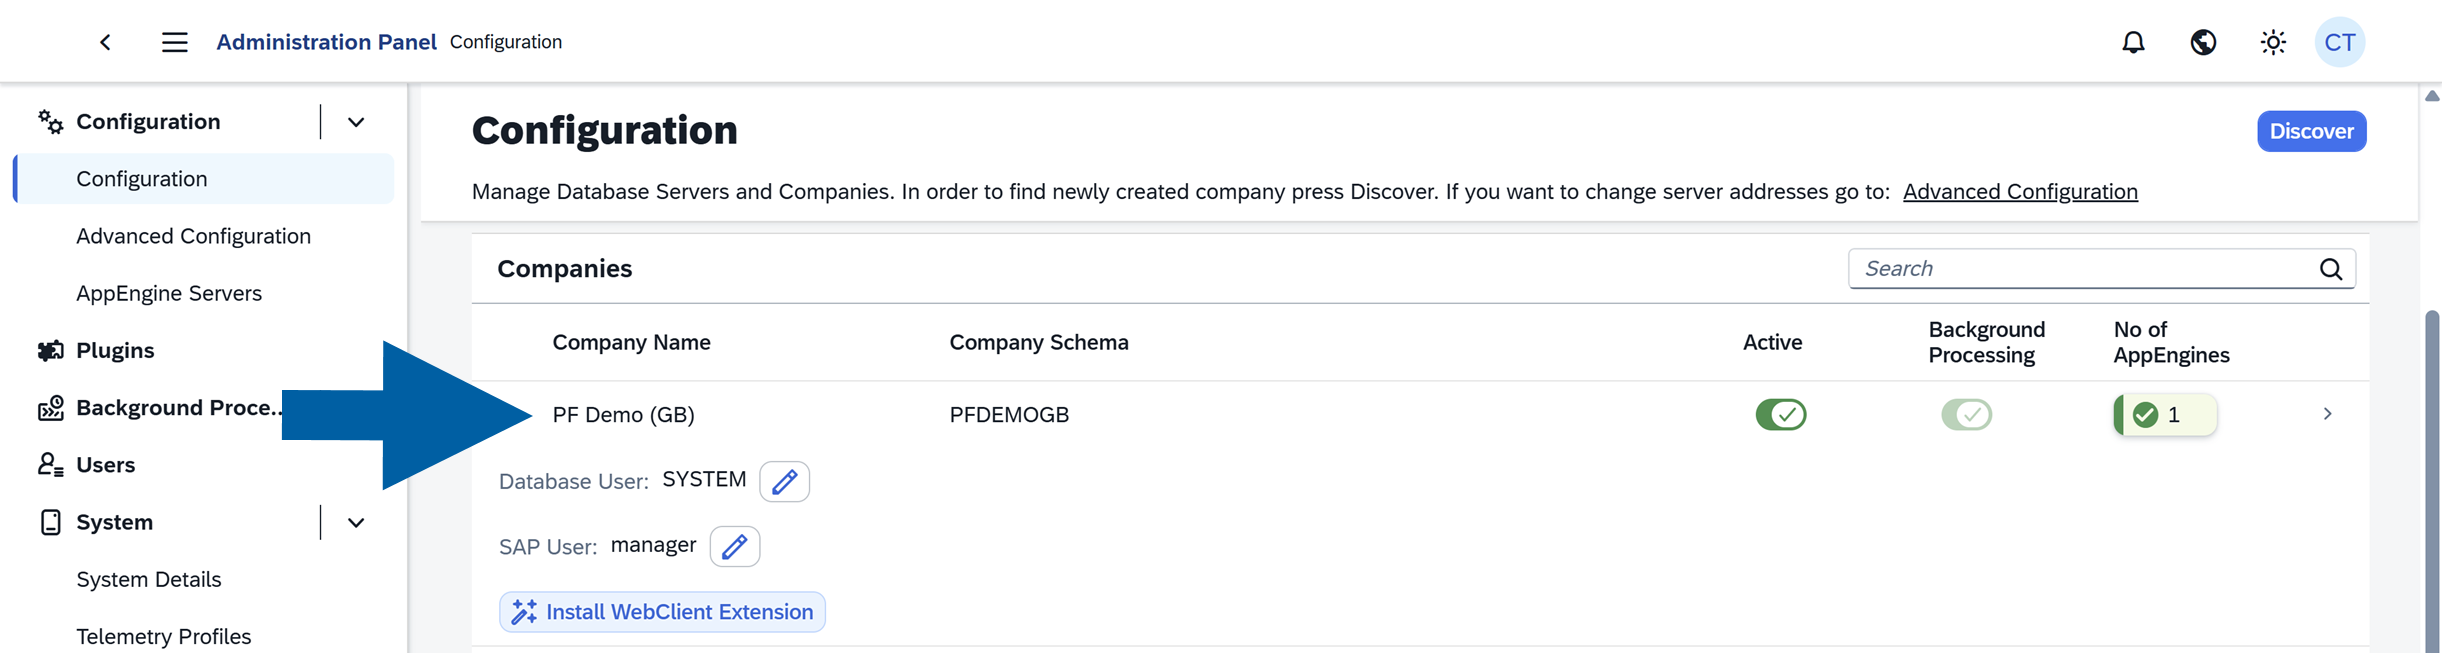 note
noteYou can assign OpenTelemetry Profiles:
- To all users in the company
- To specific users needing tailored configurations
-
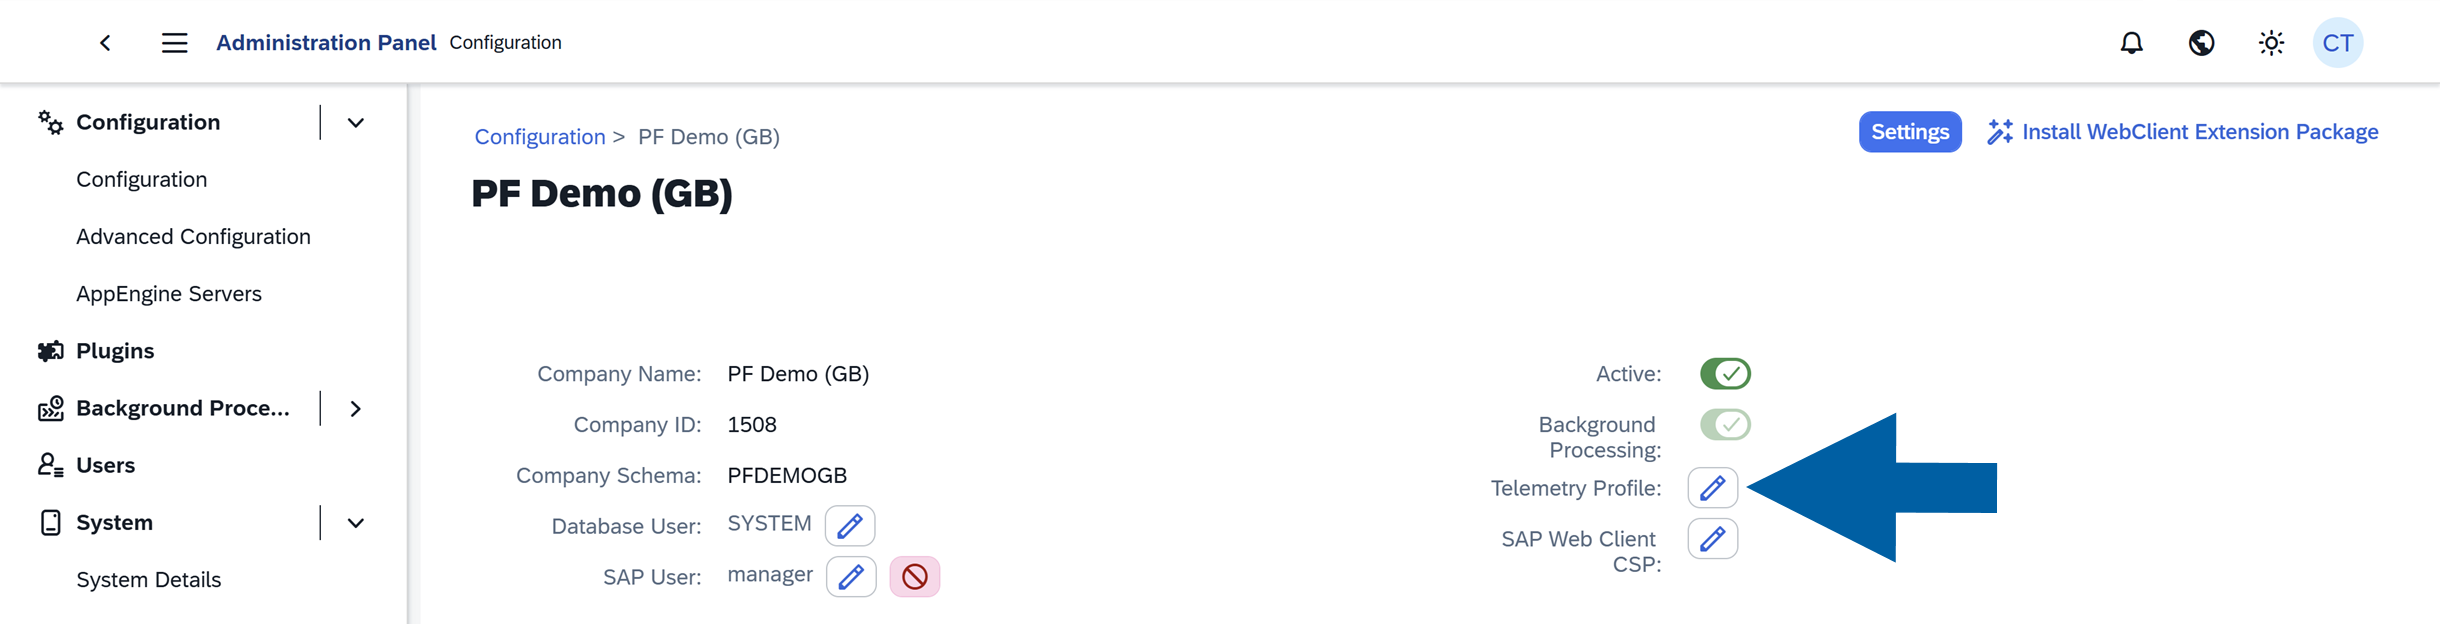
To assign the default profile to all users in the company, choose the company name from the list to see its details.
-
Click the edit icon next to Telemetry Profile.
-
Choose the OpenTelemetry profile from the list.

-
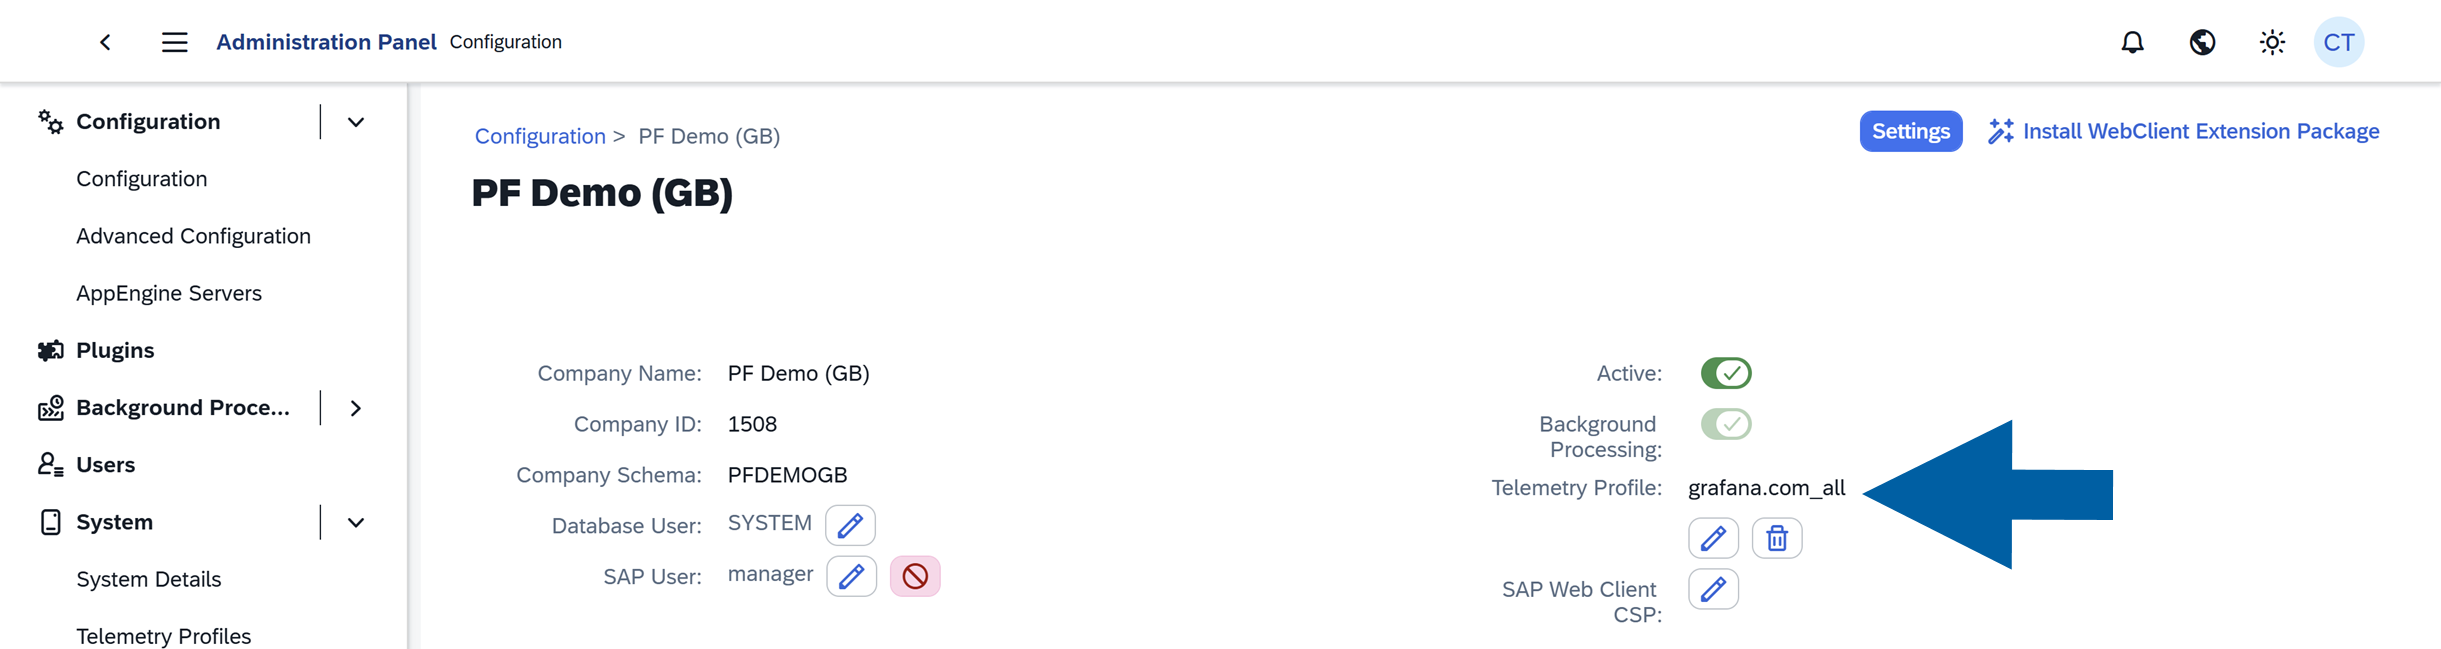
Done! Now you can see the Telemetry Profile name assigned to your company.
-
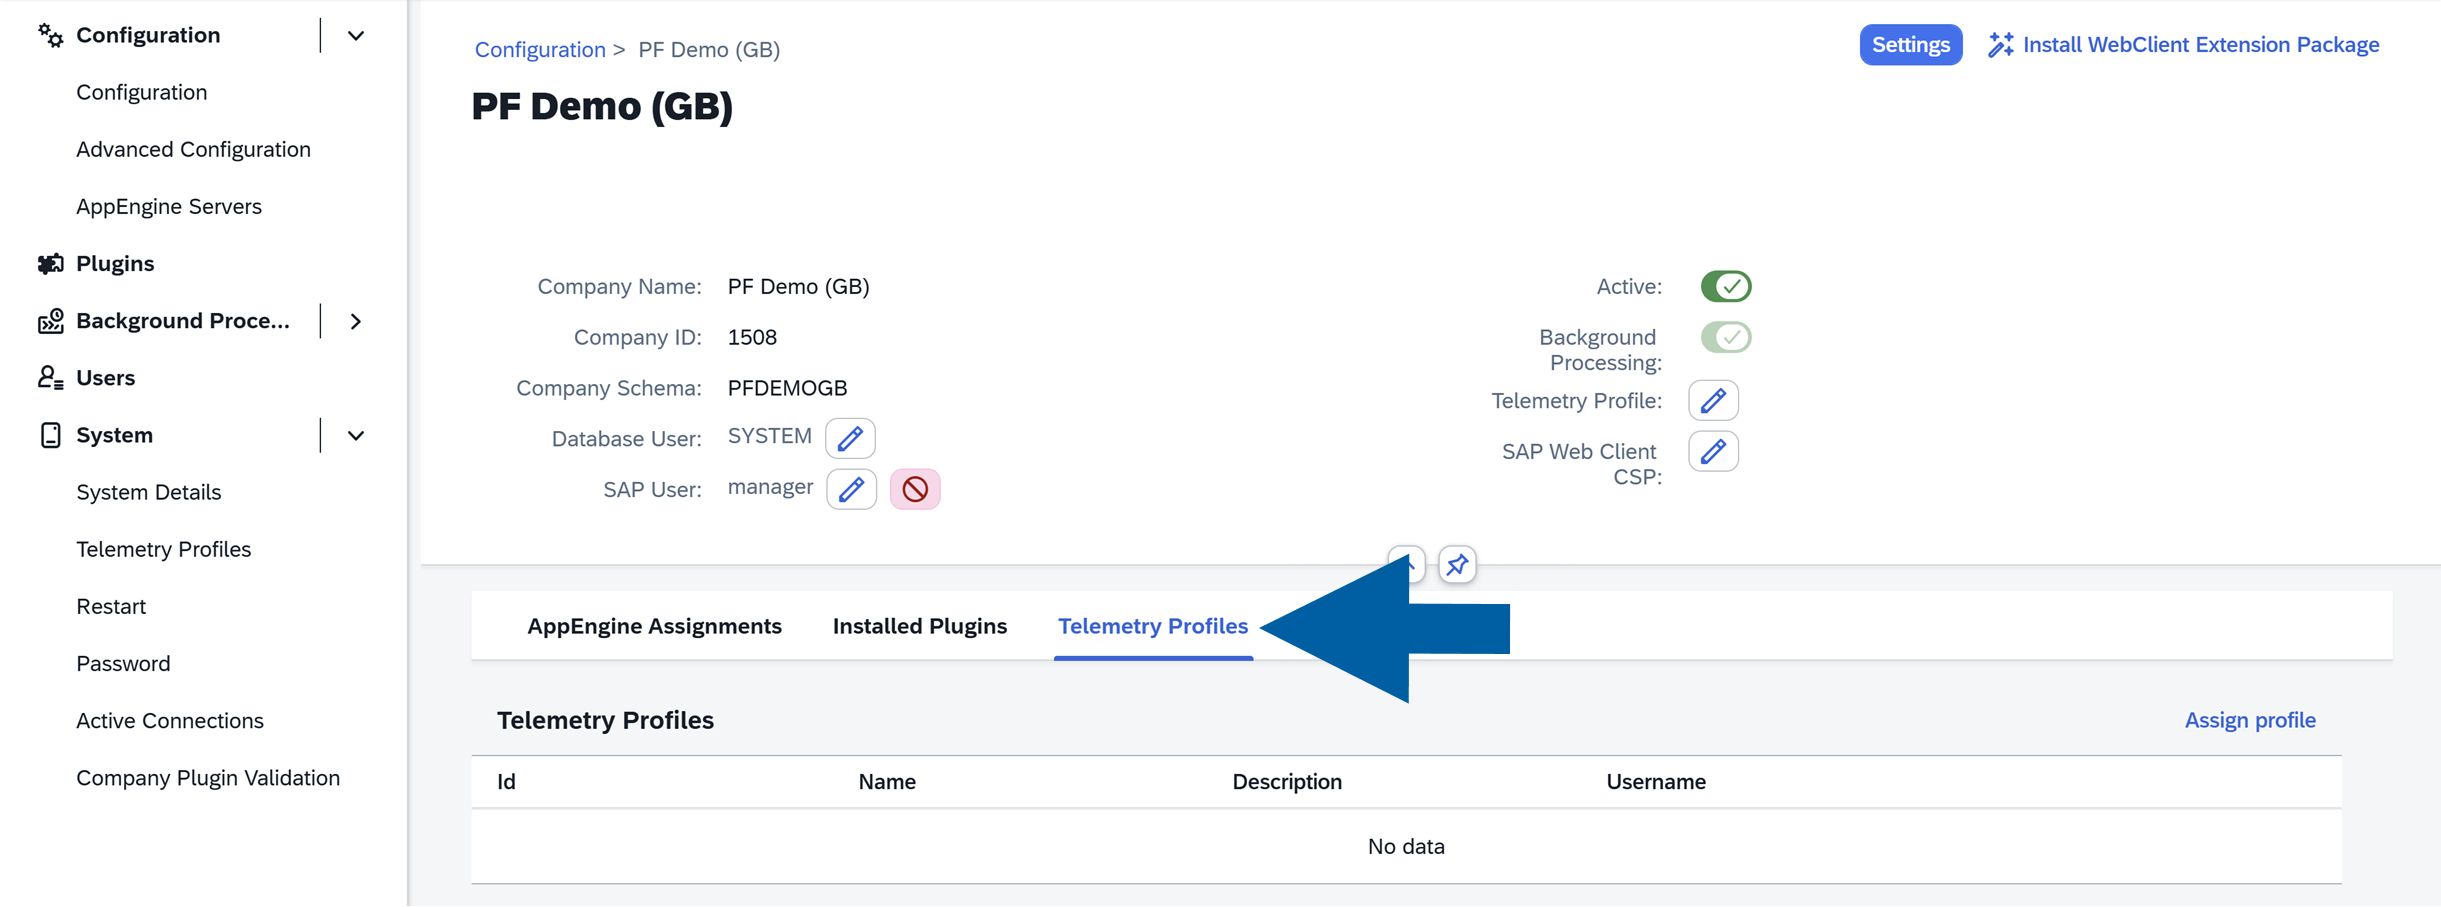
To assign the profile for a specific user, navigate to Telemetry Profiles in your company details.
-
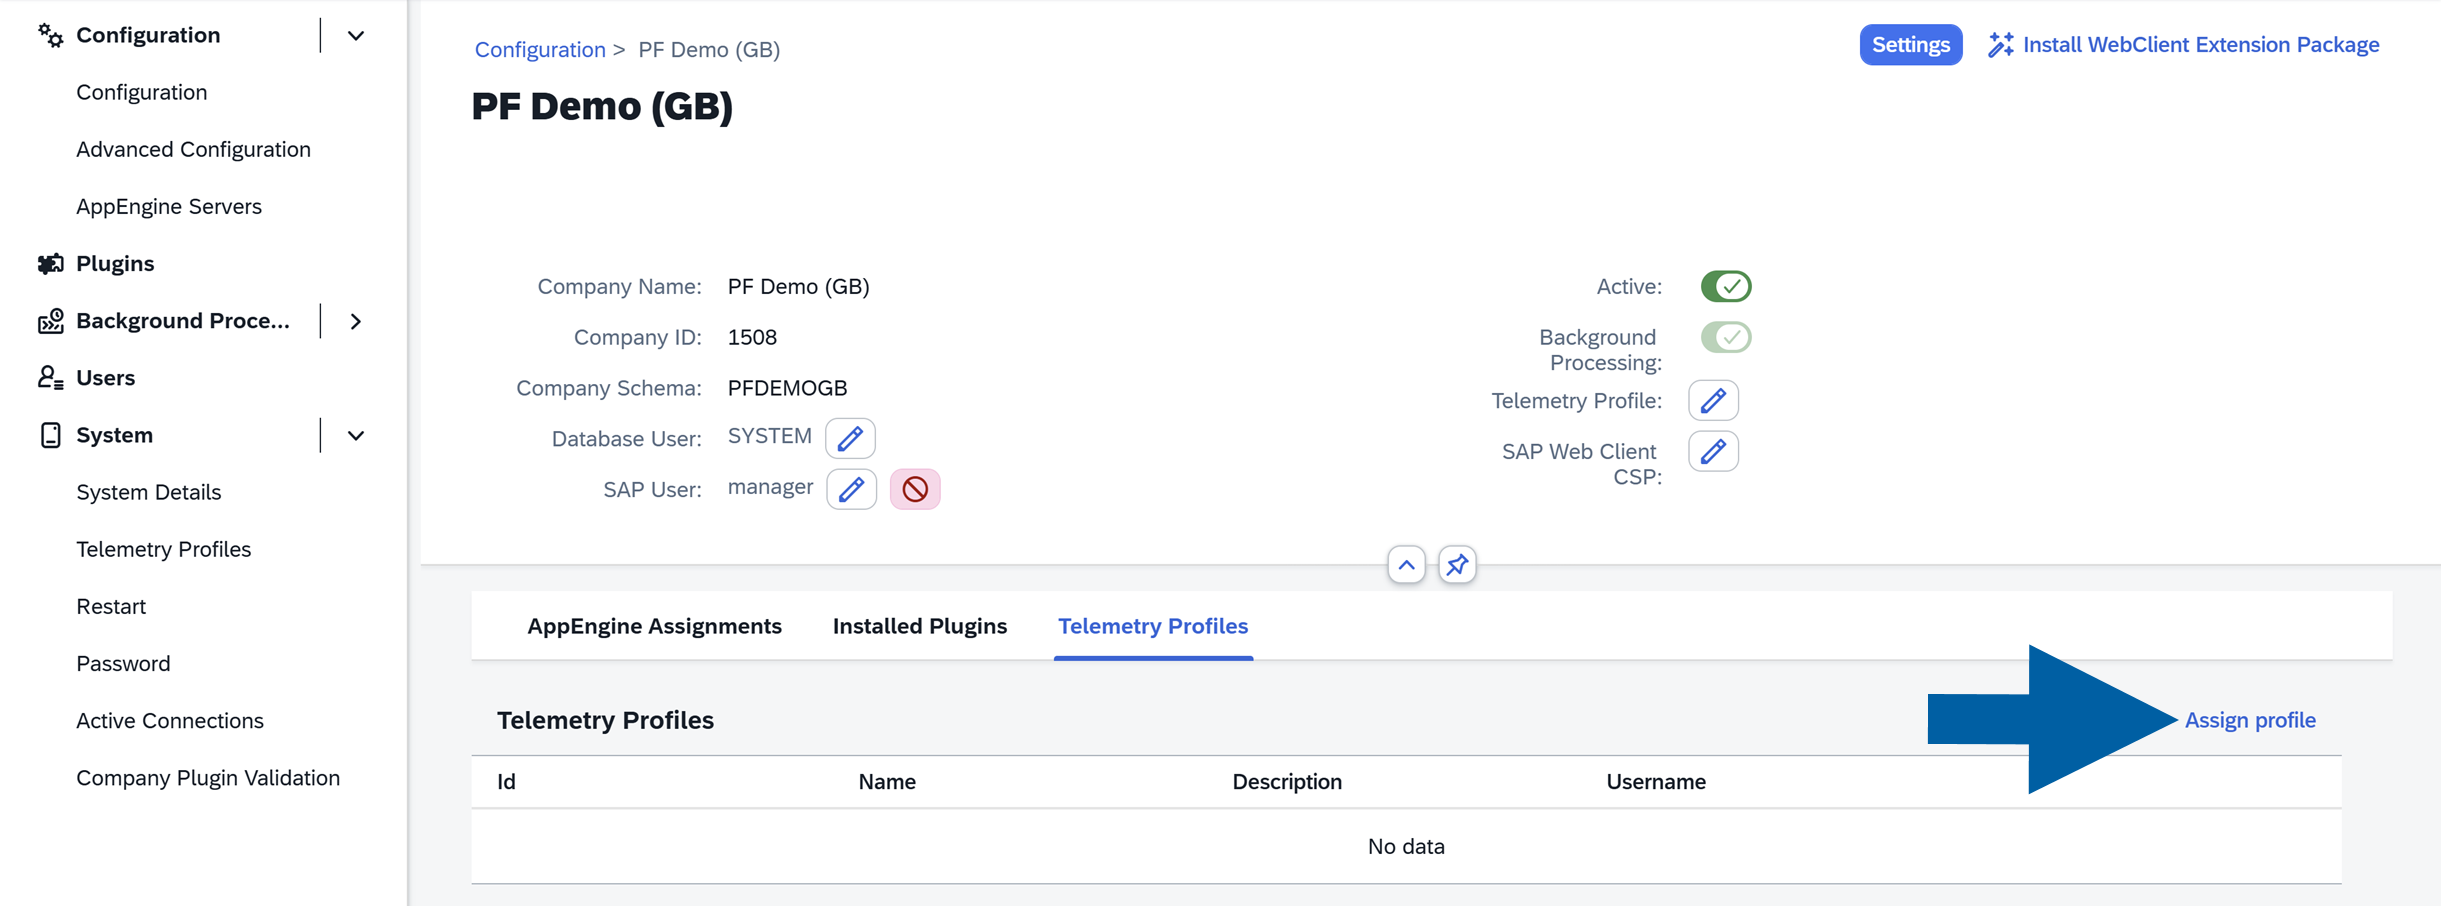
Click Assign profile.
-
Type the user name, click the edit icon to assign the chosen Telemetry Profile, and click Create Assignment.

-
Restart Sap Business One to see the changes.
Explore the OpenTelemetry Profiles and Logs
-
In Grafana, click Launch Grafana Cloud.

-
Navigate to Explore.

-
Choose the exploration method from the list:
traces: View time-based traceslogs: Inspect logsprom: Analyze metrics

-
When viewing traces, use Service Name to filter the results by service.
Available service names depend on your environment and configuration.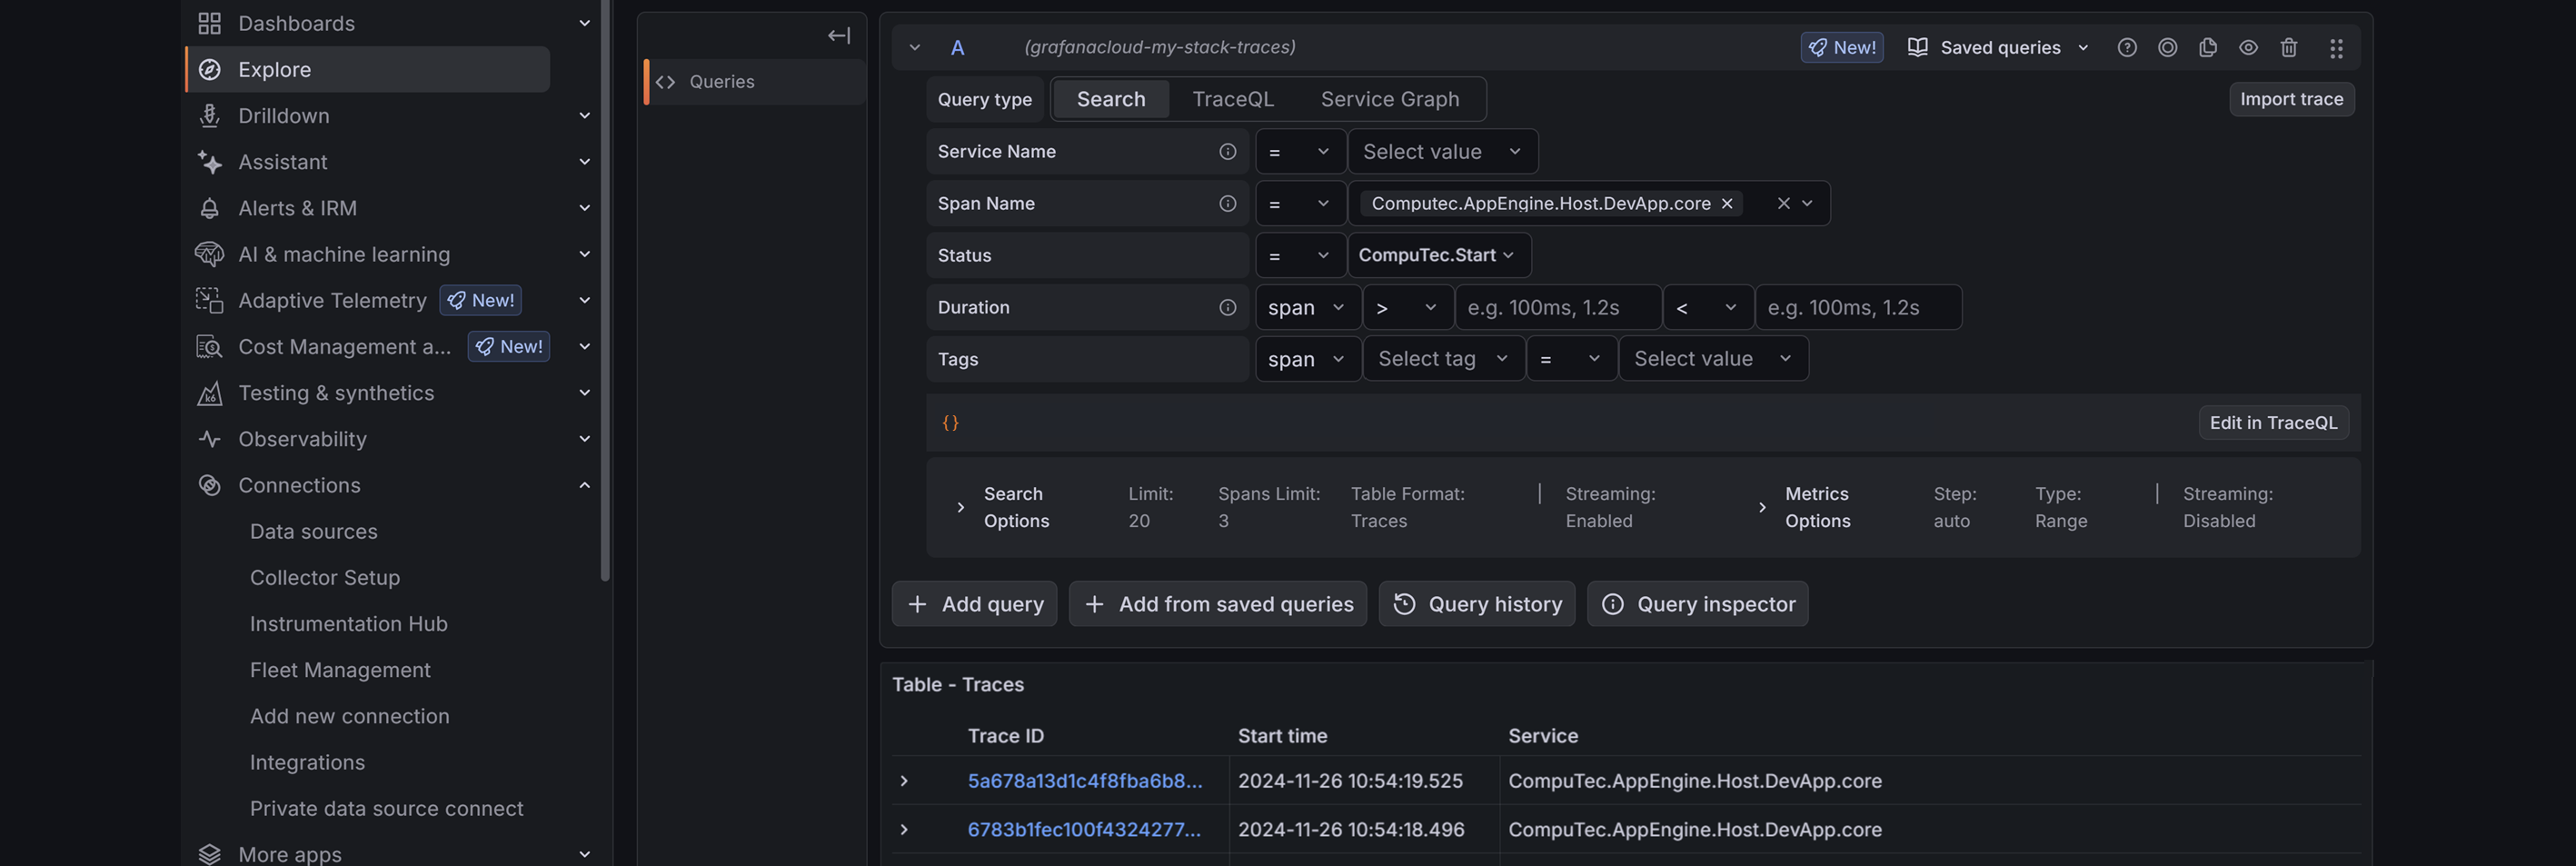
To further narrow the results by User Name or Database ID, use the Tags filter. Select resource, then select the required attribute and value.
Export log data from Grafana
You can export log data from Grafana when needed, for example, for further analysis or troubleshooting.
For instructions, see the Grafana documentation.