You are viewing documentation for CompuTec WMS 3.0, which runs on CompuTec AppEngine 3.0 (.NET 8).
If you use CompuTec WMS 2.0, see the CompuTec WMS 2.0 documentation.
When upgrading to CompuTec WMS 3.0, update all required CompuTec components together to ensure compatibility.
Before installing or upgrading, review the CompuTec WMS Installation Guide and the system requirements.
Log Files
This guide explains how to collect diagnostic information for CompuTec WMS.
You can use the sections below to:
- find CompuTec WMS log file locations
- collect server, client, and Service Manager logs
- enable additional query logging
- use Microsoft Event Viewer
- enable advanced telemetry and diagnostics for deeper troubleshooting
Find Standard Logs
Server Logs
The WMS Server stores standard logs and performance timing logs.
Logs
C:\ProgramData\CompuTec\CompuTec WMS\Server\Logs
TimeLog
C:\ProgramData\CompuTec\CompuTec WMS\Server\TimeLog
Service Manager Logs
Service Manager stores logs related to installation and deployment of CompuTec WMS objects.
Logs
C:\ProgramData\CompuTec\ServiceManager\Logs
Client Logs
Client (legacy)
Legacy client logs are stored locally for each Windows user.
Logs
C:\Users\[USER_NAME]\AppData\Local\CompuTec\CompuTec WMS\Client\Logs
TimeLog
C:\Users\[USER_NAME]\AppData\Local\CompuTec\CompuTec WMS\Client\TimeLog
Desktop Client or Android Client Logs
You can send logs directly from the client to the server.
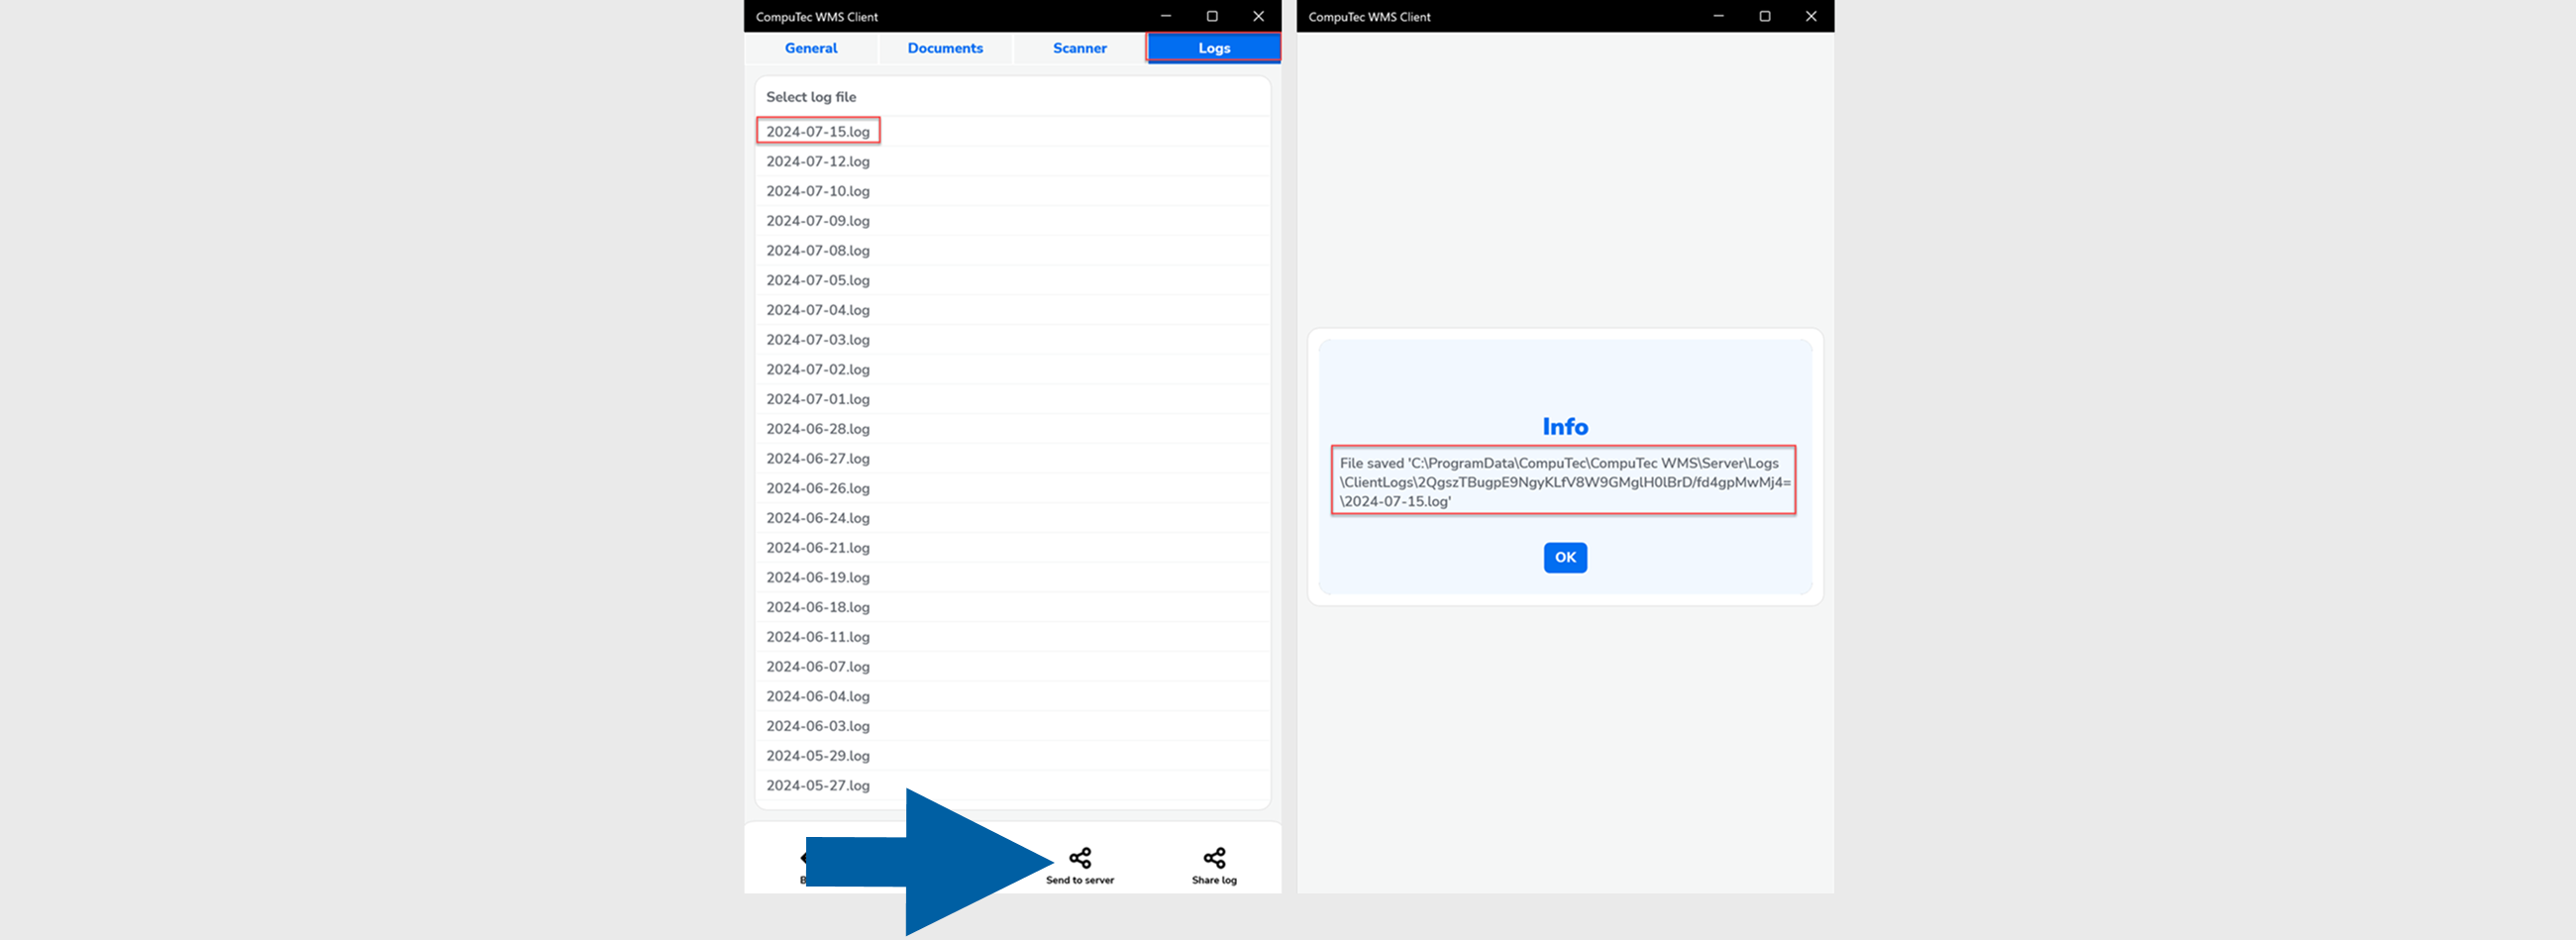
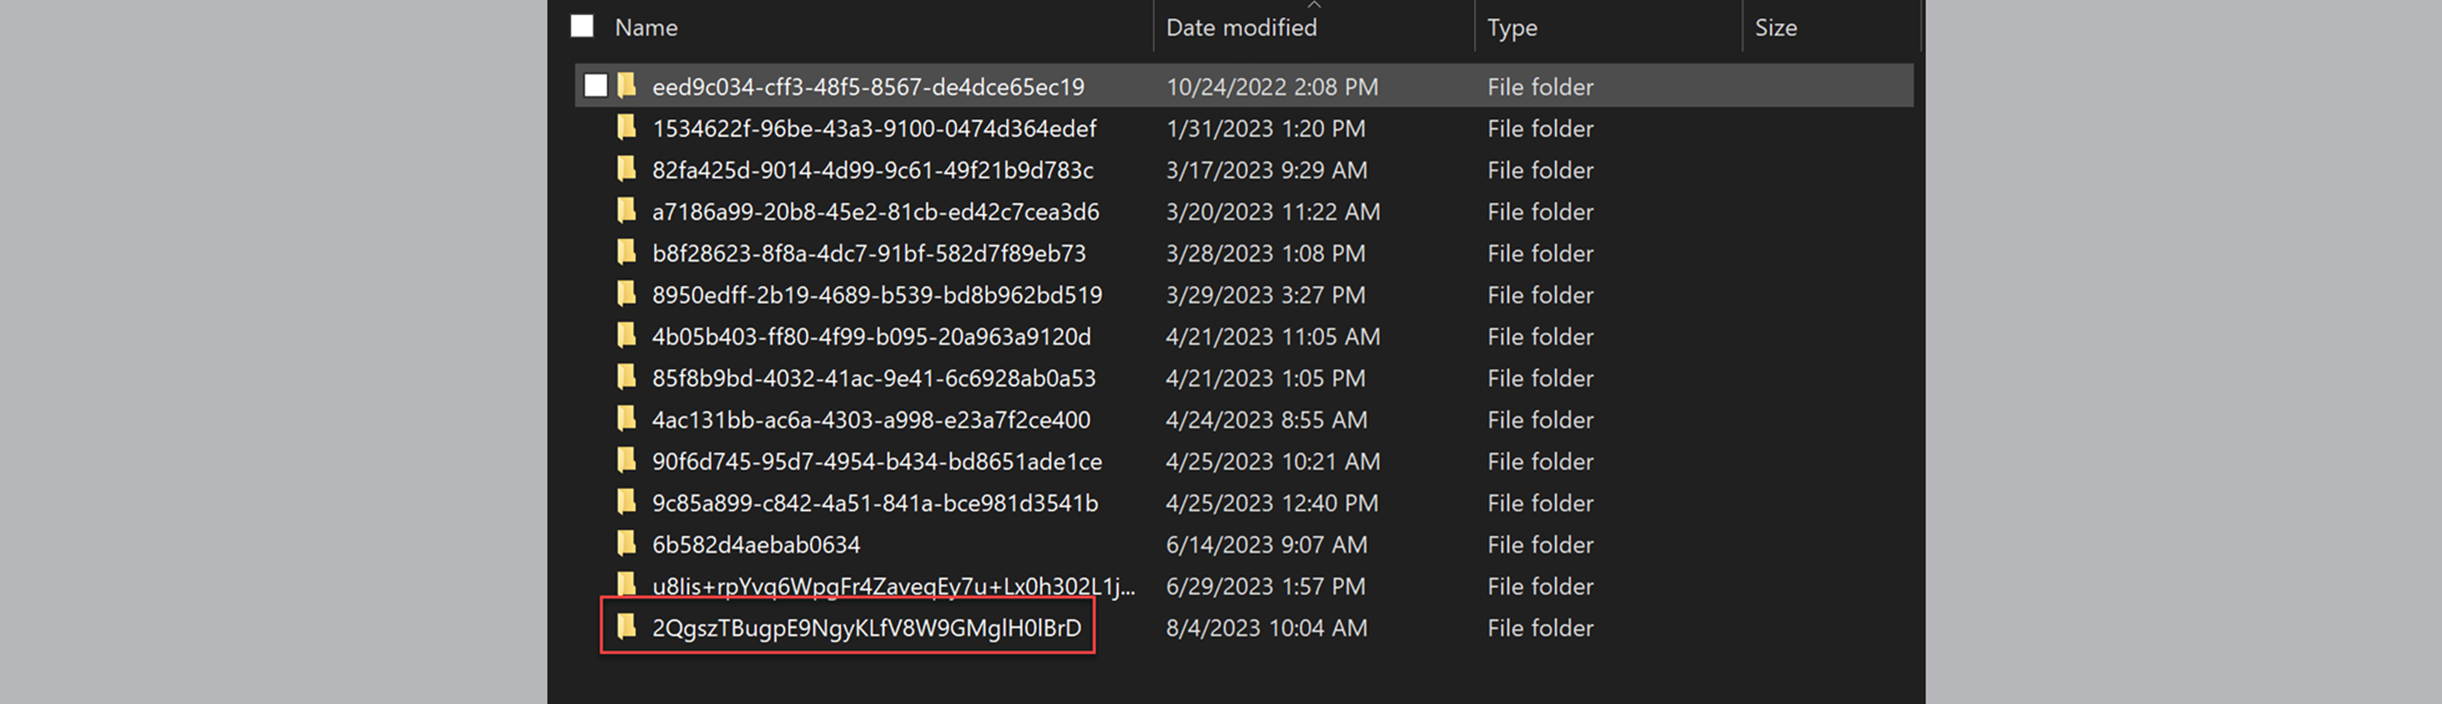
Client Logs on Server
C:\ProgramData\CompuTec\CompuTec WMS\Server\Logs\ClientLogs
This option is not available for the Legacy Client.
Collect Additional Diagnostics
Enable Detailed Query Logging
Use additional query logging when you need more detailed database execution information.
To log additional execution details by CompuTec WMS, follow these steps:
-
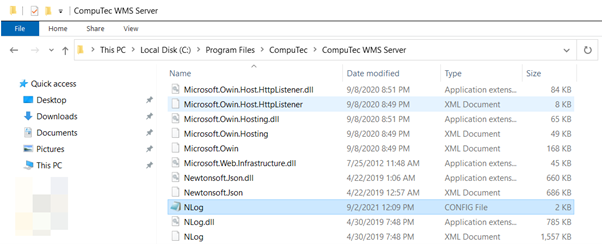
Navigate to
C:\Program Files\CompuTec\CompuTec WMS ServerorC:\Program Files (x86)\CompuTec\CompuTec WMS Server -
Open the configuration file.
-
Add the following configuration to the
<target>and<logger>sections:<target xsi:type="File" name="fileEventLogForQueries" fileName="${specialfolder:folder=CommonApplicationData}\CompuTec\Computec WMS\Server\Logs\queries ${shortdate}.log" layout=" ${time} ${message} ${stacktrace:format=DetailedFlat:topFrames=5}" />WMS 2.0:
<logger name="QueryNLogger" minlevel="Trace" writeTo="fileEventLogForQueries" />WMS 3.0:
<logger name="CompuTec.Core2.DI.Database.*" minlevel="Trace" writeTo="fileEventLogForQueries" />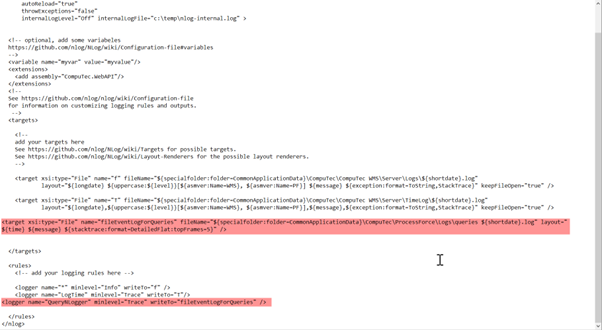
-
Save the file and reproduce the issue.
-
The generated query log file will be created here:
C:\ProgamData\CompuTec\CompuTec WMS\Server\Logs\queries. Upload this file when requested by CompuTec Support.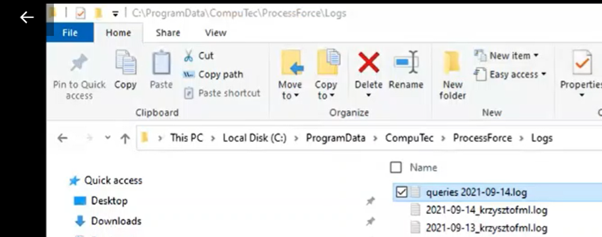
Microsoft Event Viewer Logs
You can also review logs using Microsoft Event Viewer.
MS Event Viewer may provide additional system-level information that is not available in standard CompuTec WMS logs.
Enable Additional Telemetry for CompuTec WMS Server
This section describes how to enable additional telemetry and diagnostic tracing for the CompuTec WMS Server.
Before making any changes, create a backup copy of the following file:
C:\Program Files\CompuTec\WMS Server\app.config.json
To enable additional telemetry:
-
Navigate to:
C:\Program Files\CompuTec\WMS Server. -
Locate the file: app.config.json.
-
Open the file in a text editor (for example, Notepad running as Administrator).
-
Add the following section to the file:
"CoreDiagnostics": {"IoCTrackingEnabled": false,"LoggingEnabled": true,"TracesEnabled": true,"TraceSources": ["CompuTec.*","SignalR.RedisMessageBus","Microsoft.AspNetCore.SignalR.Server","Microsoft.AspNetCore.SignalR.Client","SignalR.Transports.WebSocketTransport","SignalR.Transports.ServerSentEventsTransport","SignalR.Transports.TransportHeartBeat","System.Net.Http","Experimental.System.Net.*"],"MetricsSources": [],"LoggingOtlpExporter": {"ExporterType": "OtlpExporter","Enabled": true,"Options": {"Endpoint": "https://otlp-gateway-prod-eu-west-2.grafana.net/otlp/v1/logs","Protocol": "HttpProtobuf","Headers": "Authorization=Basic MTQ5OTAxNzpnbGNfZXlKdklqb2lNVFkwTkRVMk1pSXNJbTRpT2lKemRHRmpheTB4TkRrNU1ERTNMVzkwYkhBdGQzSnBkR1V0ZDIxemMyVnlkbVZ5ZEc5clpXNGlMQ0pySWpvaU0wd3hlVTV2T0RReU1EVk9NVXQwTUdwVmFsSTFTa1YzSWl3aWJTSTZleUp5SWpvaWNISnZaQzFsZFMxM1pYTjBMVElpZlgwPQ=="}},"TracesOtlplExporter": {"ExporterType": "OtlpExporter","Enabled": true,"Options": {"Endpoint": "https://otlp-gateway-prod-eu-west-2.grafana.net/otlp/v1/traces","Protocol": "HttpProtobuf","Headers": "Authorization=Basic MTQ5OTAxNzpnbGNfZXlKdklqb2lNVFkwTkRVMk1pSXNJbTRpT2lKemRHRmpheTB4TkRrNU1ERTNMVzkwYkhBdGQzSnBkR1V0ZDIxemMyVnlkbVZ5ZEc5clpXNGlMQ0pySWpvaU0wd3hlVTV2T0RReU1EVk9NVXQwTUdwVmFsSTFTa1YzSWl3aWJTSTZleUp5SWpvaWNISnZaQzFsZFMxM1pYTjBMVElpZlgwPQ=="}}}Alternatively, you can replace the existing file with the prepared version available for download here.
-
After saving the changes:
- Restart the WMS Server service.
- Perform the required tests using the WMS Client.
-
After completing the tests, restore the original app.config.json file.